
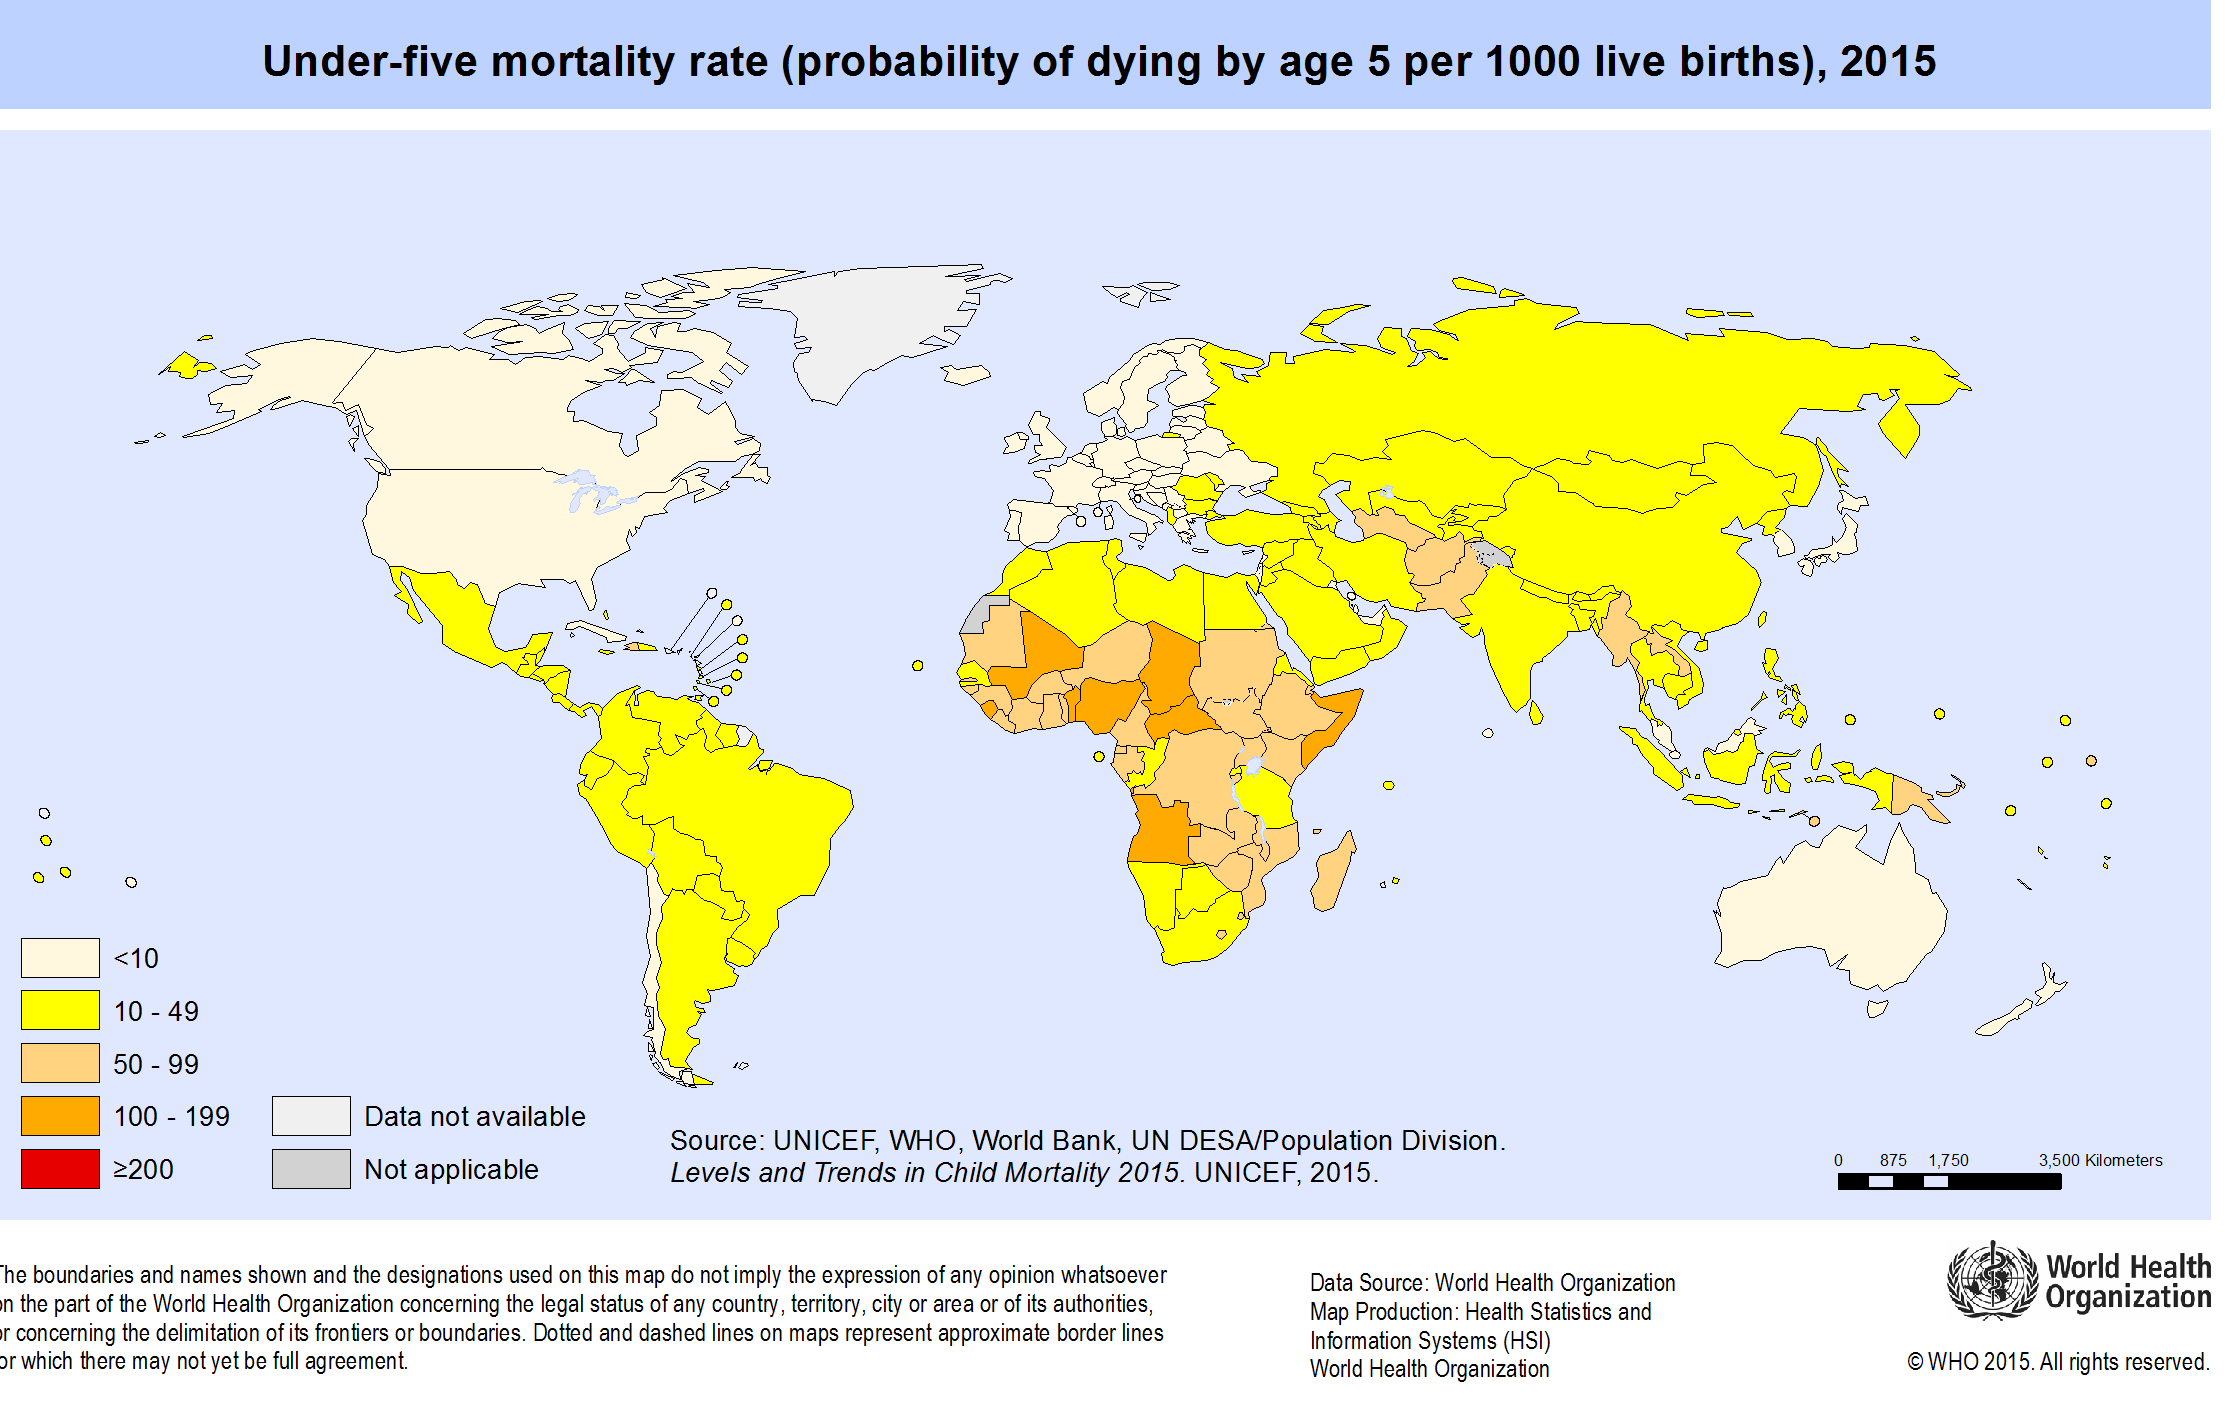
World Map of under-five mortality, 2015. Source WHO
Why model global health estimates?
Global health indicators are vital to track progress towards internationally agreed goals – eg the Sustainable Development Goals – and for donors to prioritize their investments. But in some countries, the data are sparse and of poor quality. A little less than half the deaths in the world, for example, are registered with their cause. National death registration data are only available for four African countries.(World health statistics, 2017) Useful population level data on incidence or prevalence of disease and injury are even less available.
To cope with data gaps, international agencies and academics use statistical models to prepare estimates of key health indicators that are comparable across countries and/or time. The agencies derive these estimates using reported or published data from multiple national sources such as civil registration, health management information systems and population surveys.
Global estimates can be useful to countries for:
- Comparative analyses of country values (benchmarking with peer countries);
- Monitoring progress and reporting for global and regional goals and targets;
- Reporting to donors and development partners, for example for performance-based grants;
- Estimating completeness and accuracy of empirical reported data.
Common sources of bias
A group of agencies identified the following sources of bias in country data (see the GATHER statement).
Inconsistent case definitions or diagnostic criteria
Health data often identify persons who test positive for a particular case definition. Case definitions may vary by data source, limiting their comparability. Assessors’ qualifications may vary, which can lead to differences in ascertained prevalence of the condition. Laboratory protocols may change over time, reducing comparability even when case definitions have not changed. Changes in sensitivity or specificity of detection methods can have an important effect on case identification, as can decisions about whether to adjust for sensitivity or specificity.
Self-report biases
With some survey instruments, systematic biases can arise from difficulties in obtaining accurate responses from survey respondents. Examples of self-report biases include recall bias or social desirability bias. Self-reports of prior diagnosis often underestimate the true incidence or prevalence of a condition since some cases do not interact with the health system or are not diagnosed. These biases may vary systematically by populations and over time.
Incomplete population-based surveillance
Surveillance and registration systems designed to capture all events in a population are often incomplete. It may be difficult to quantify levels of completeness for events such as infectious disease incidence. For other types of events, demographic techniques or capture-recapture techniques may allow estimation of completeness.
Non-representative population bias
Some data types are collected for a subset of the general population by design, e.g. when data are collected from clinic attendees or samples of volunteers, or when data pertain to urban or rural groups only. Health status and health determinants may differ systematically between these selected populations and the general population.
Types of modelling
Mathematical models set up a theoretical framework that represents and quantifies the causal pathways and mechanisms linking determinants and health outcomes. These types of models make predictions of health outcomes (which may be difficult to measure) based on parameter estimates derived from various data sources. The first GBD Study used a simple mathematical model. The Comparative Risk Assessment methodology developed by WHO in the early 2000s also used a mathematical modelling framework.
Analysts most frequently use statistical modelling to make global estimates. Statistical models estimate or predict outcome indicators using empirical data on the outcome as well as on correlated variables, or covariates. Statistical models commonly use regression techniques, identifying a functional form which fits the data, and which gives an adequate summary of the variation in the data.
Whereas explanatory modelling seeks to accurately characterize relationships between variables in the data, prediction modelling aims only to predict outcomes.
Statistical models may estimate and use the correlation between data observations and covariates to improve predictive validity. Statisticians use this approach to generate values for indicators in settings with no or very limited primary data on the outcome of interest, for example levels and trends in maternal mortality and other causes of death. Issues of causality are irrelevant for these types of models. Users must be warned not to interpret the associations in causal terms and analysts should not restrict their choice of covariates to those they believe to be causal. The aim is accurate prediction.
When is modelling useful?
Improve accuracy and comparability
One major purpose of statistical modelling is to process raw data to improve its accuracy and comparability. Incompleteness of Surveillance or registration data is an important source of bias that estimates must address, and is a challenge because assessments of completeness cannot use primary data alone, and must employ external data.
Analysts may address bias resulting from definitional and measurement issues a priori by adjusting the data before statistical modelling drawing on external information.
For example, it is possible to adjust the prevalence of hearing loss measured using different loudness decibel thresholds to a common threshold using a known or assumed relationship between threshold and cumulative prevalence. Alternately, adjustment of data using different measurement strategies may be carried out statistically in the model. This is known as cross-walking to a standard definition. For example, for multiple hearing loss surveys with different thresholds, analysts can use statistical models to estimate the relationships between thresholds and prevalence and estimate a standard set of thresholds for all the populations.
Synthesise data from multiple sources
Statistical modelling can generate comparable and consistent indicator values across populations and/or time – based on all the data which meet inclusion criteria.
For example, some countries have multiple sources of data on under-five mortality, such as from the census and household surveys. Synthesizing data makes use of all existing information of sufficient quality, thereby avoiding the arbitrariness of an analyst picking the best single data source, which is challenging given the presence of measurement error. This approach is similar to estimating a treatment effect through a meta-analysis of several randomized trials as opposed to picking the treatment effect from only one of the trials.
Fill data gaps in time series
To fill data gaps in time series and project to a common target year or range of years. For most types of raw data, the date of most recently available data varies across populations. Because analysts usually want to estimate trends to a common recent year across all populations, they include a projection component in the model. These imputation methods often borrow information from neighbouring data, which could be, for example, from countries in the same region or other time points in a country’s primary data series. Analysts may also seek to improve imputations and projections by including predictor variables in the model that correlate with the quantity of interest, or covariates.
Estimate quantities that cannot be directly measured
When it is difficult or costly to measure a health outcome, it may be more feasible to measure intermediate outcomes, and then use a model to extrapolate to the outcome. Such models usually involve mathematical modelling of the causal chain.
For example, WHO has based its estimates of measles mortality on estimates of measles cases multiplied by separately estimated case fatality rates.
Evaluate large scale interventions
when a randomized controlled trial is not possible for ethical or practical reasons. Investigators observe trends in the outcome of interest with the programme in place and develop a counterfactual model to estimate the outcomes in the absence of the programme. This approach can also be used to assess the potential impact and cost-effectiveness of proposed interventions.
Forecast indicators
for a standard time frame (base year to latest target year) using a forwards (and sometimes backwards) projection component. In some cases, the main aim of the modelling is longer range projection or forecasting. These types of models fall into two main classes:
- Deterministic covariate driven projections that are usually scenario-based. These allow for modelling of alternate future policies or interventions through covariates or other modifiable parameter assumptions
- Statistical forecasts using time-series projection techniques to extrapolate historical trends. Hybrid models combine stochastic time series projections with covariate drivers and multilevel modelling.
Statistical modelling
Estimation using covariates
When using covariates, there is a danger that estimated trends reflect changes in covariates rather than changes in the estimated outcome indicator, particularly when there is little outcome data. For example, models to predict maternal mortality often include covariates such as gross domestic product (GDP) per capita which can vary depending on commodity prices. Rising GDP per se may have next to no impact on maternal health over short time periods. But a model that includes GDP as a covariate will predict reductions in maternal mortality.
Inclusion of data type covariates in a regression is a common strategy when there are datasets or countries where data are available according to several definitions. It is possible to cross-walk to the preferred definition by including indicator variables for each alternate data types in a regression analysis and then setting data type to the preferred type for producing regression estimates. Alternately, it may be more convenient to do the cross-walking as a pre-processing step based on a separate regression analysis. An example is a recent study of diabetes mellitus prevalence which included some data sources that identify diabetes using HbA1c measurements and others that measure fasting plasma glucose.
An example of the use of covariates for both prediction of levels and trends and for cross-walking between two data types is the WHO model for estimating national homicide rates across countries. The final model after cross-validation included covariates for alcohol drinking pattern, gender inequality index, percent of the population living in urban areas, proportion of the population that are 15-30 year old males, religious fractionalization, and infant mortality rate. An additional covariate for data type distinguished data from criminal justice systems and police from data derived from death registration, and adjusted for the differences between them.
Frequentist versus Bayesian estimation methods
Frequentist statistical methods are based on interpretation of probabilities as objective summaries of repeated trials of the same process. Frequentist statistical modelling methods (such as ordinary least squares regression) rely on maximising a likelihood function which summarizes the conditional probability of the actual observations as a function of the parameters to be estimated.
The Bayesian paradigm treats probabilities as subjective assessments based on prior knowledge (prior probability distributions) which are updated in the light of observed data. Bayesian methods generally allow the fitting of more complex and flexible models that seek to make many internal adjustments, enable more appropriate uncertainty characterization, and avoid the approximations required for many classical frequentist methods. These methods require greater computation than frequentist methods. With increasing computing power, Bayesian methods have become tractable for virtually all parametric methods and are being increasingly adopted for global health modelling, for example, UN agencies now use Bayesian methods to monitor child and maternal mortality.
Uses of statistical modelling
Complex curve fitting
Complex curve fitting to produce smooth estimates across multiple observations. Complex curve smoothing, or time series projections allow flexibility in curve fitting, use multiple and sometimes overlapping data inputs.
For example, the UN Interagency Group on Mortality Estimation (UN-IGME) formerly used a loess regression method to estimate trends in child mortality for a country across a standard time period.(29, 30) This method only used country-specific data to interpolate and extrapolate a smooth curve for a single population. UN-IGME now models time trends using Bayesian bias-adjusted B-splines which allow more objective curve fitting than loess regression. We describe this example to illustrate the increasing sophistication of statistical modelling.
Using the B-splines model, the UN-IGME estimates a best fit trend line for the under-five mortality rate (U5MR) based on multiple observations from multiple surveys at uneven intervals (known as the B3 model, see Figure 21.2). The B-splines model includes a data model which simultaneously adjusts for statistically estimated biases for each type of measurement technique (such as indirect birth history versus direct birth history).
Suppose, on average (across all country data) indirect birth history observations were 10 per cent lower than the final child mortality estimates based on all types of data. The model will upwardly adjust to the indirect birth history observations when estimating the final curve for child mortality rates. This means that the final estimated U5MR curve for a country depends on the data for all countries, not just specific to the country. If a country only has observations from biased data sources, the final estimates may lie entirely outside the original, raw data observation. This is often difficult to explain to users of the statistics.
Multilevel modelling
Multilevel modelling to improve the quality and stability of estimates based on relatively sparse data. Multilevel or hierarchical regression models allow for simultaneous modelling of parameters that vary at more than one level (for example, country, region and world). Modelling parameters hierarchically allows data from other countries within a region, and in other regions to inform estimation for countries with poor or missing data. In non-hierarchical regression models, a group dummy variable could be included to estimate the variation between groups as a fixed effect. Hierarchical models also permit the inclusion of random effects, which allows the model to share information from higher levels of the hierarchy to a greater extent when data from lower levels are poor (29).
For example, Paciorek et al used a Bayesian hierarchical model to estimate distributions of height-for-age and weight-for-age by place of residence (urban or rural) for 141 countries over a 35-year period. The estimated values for each country-year were informed by data from the country-year itself, if available, and by data from other countries, especially those in the same region. The authors of the study explained that ‘The hierarchical model shares information to a greater extent when data are non-existent or weakly informative (eg, because they have a small sample size), and to a lesser extent in data-rich countries and regions.’
Complex predictive models
Complex predictive models to interpolate and extrapolate outside the available data. Most statistical models use more than one of the techniques outlined above, including use of time-varying covariates, a multilevel structure, and a temporal smoothing technique.
For example to estimate maternal mortality trends by country, the UN system uses a multilevel Bayesian regression model with time series modelling and covariates and random effects. The Maternal Child Health Epidemiology Estimation collaboration with WHO uses a multinomial regression model, with covariates and fixed effects, that simultaneously models a complete set of cause of death fractions.
Other examples of complex statistical models include use by the IHME of Gaussian process regression to borrow strength and smooth across space and time. Use of these statistical imputation and prediction methods along with predictive covariates now enable relatively sparse data to become big estimates with health indicators imputed to detailed spatial-temporal grids, for example five km x five km grids for the world over 15 years.
Model frameworks and validation
Validation of predictive models differs from validation of explanatory models.
Analysts validate explanatory models by examining whether their structure adequately represents the data and if the model fits the data. For example, validation of an explanatory model would examine whether addition of extra covariates to the model, transformations of covariates, or additional nonlinear terms significantly increase its explanatory power. Model fit is assessed using goodness-of-fit tests and model diagnostics such as residual analysis.
In contrast, for predictive modelling where observations are missing for some populations or time periods, the focus of validation is on the ability of the model to predict missing data. This usually involves withholding some of the data from the model fitting and then testing the accuracy of the model predictions against the withheld data, known as out-of-sample predictive validation or cross-validation. Predictive validity depends on the question being asked and the nature of the data to which it is being applied. So there is no standard metric for evaluation of model performance.
For example, a model may be focused on estimation of the outcome for all countries for a target year that falls outside the dataset. This will require the model to be particularly good at out-of-time predictions. If the focus is on prediction for countries with no primary data, the model predicts well out-of-sample across countries.
For assessing the predictive validity of cause-of-death models used in the GBD 2010 study, the withheld data consisted of a mix of five types of missing data: countries with no data, countries with missing data years within the available data, countries with missing data years at earlier time periods, countries with missing data for later time periods, countries with data missing for some age groups (see Arlot and Celisse, and Barai and Reich.
Advances in other disciplines, have found that an ensemble modelling approach may give better predictive validity than any single model. Recent modelling in the global health field has used ensemble models that are the weighted combinations of different models. Such ensemble modelling typically requires two sets of withheld data for validation. The first set is used to assess the predictive validity of the individual models, and the second set is used to assess and maximise the predictive validity of the ensemble average.
Presenting results
The accuracy of the estimates depends on the methods used to create them. More importantly, the amount and quality of data depend upon which they are based. Poor data quality or availability means alternative methods can lead to substantially different final estimates. This can lead to considerable confusion among global agencies and donors.
GATHER
In 2016, a group of agencies came together to agree best practices in reporting health estimates. They published the Guidelines for Accurate and Transparent Health Estimates Reporting (GATHER) statement which included a checklist of 18 items that should be reported every time new global health estimates are published. Key items in this checklist include:
- information on all included data sources and their main characteristics
- a detailed description of all steps of the analysis
- types of uncertainty quantified and the methods used
- how to obtain the analytic or statistical source code used
- reasons for changes if updating an earlier set of estimates
- a discussion of the modelling assumptions and data limitations that affect interpretation of the estimates.
GATHER provides an achievable standard for reporting health estimates. But there are many challenges in implementation. Full documentation of a study typically requires lengthy technical appendices. It also requires open access to input data and computer code. This implies an additional reporting burden when publishing estimates. A clear description of the methods and fair discussion of limitations are more important for understanding of estimates. But are not easy to provide or verify.
Uncertainty estimation
Quantifying uncertainty around modelled health estimates – typically by calculating and reporting uncertainty intervals – was considered by the GATHER working group to be a necessary component of reporting results, encouraged by GATHER. Uncertainty ranges help users understand the precision of the estimates, and are critical for making comparisons. However, the inclusion of the main sources of uncertainty usually requires substantial statistical expertise and computing power.
Potential sources of uncertainty include stochastic errors, sampling error, non-sampling errors (resulting from measurement errors, missing data, errors in coverage, and other systematic biases), error in model covariates, parameter uncertainty, model specification uncertainty, fundamental uncertainty, and uncertainty arising from various data transformation steps and externally derived parameters. In practice, most quantitative uncertainty estimates reflect only a subset of all possible sources of uncertainty in the estimates.
There is no established methodology for estimating some types of uncertainty. Analysts use different methods or develop new methods. They may ignore the source of uncertainty and acknowledge this as a limitation of their analysis. In many cases, the data and information needed to quantify uncertainty do not exist. For example, some sources of uncertainty may be unknown, or impossible to measure. This means that some modelling approaches have wider uncertainty than others. This may be simply because the some may be capturing more sources of uncertainty. In general, accounting for multiple sources of uncertainty – and correctly reflecting these sources in resulting estimates – is more straightforward for Bayesian approaches. Uncertainty in values of covariates is typically not available and not included in quantitative uncertainty ranges for modelled indicators. For example for covariates such as average income per capita or in denominator values such as population estimates,
Sensitivity analysis
All estimation processes involve assumptions. These include about inclusion criteria for data and the functional form of a model. Some analysts may choose to use sensitivity analysis to assess the degree to which the final values of the estimates depend on these assumptions. The sensitivity analysis may suggest that various analytical approaches produce similar estimates. This lends credibility to the estimates and strengthens the results. On the other hand, the sensitivity analysis may suggest that the estimates are highly dependent on the modelling approach or on the data inclusion or exclusion criteria. This encourages readers to examine carefully the analytical assumptions, and may help to inform future research.
Transparency, replicability and complexity
Transparency is at the heart of controversies about global health estimates. The more diverse the available raw data, the modifications to the raw data and the statistical model, the more difficult it is for an external party to understand and replicate the findings. Also, analysts need to consider the benefits of developing complex models. If their resulting estimates are similar, a simpler model that others can more easily replicate and use is likely to be more effective.
Furthermore, while it is of value to offer greater technical documentation as per the GATHER guidelines, this alone may not be enough to inform users about appropriate interpretation. Many lack the technical skills to understand the methods and their limitations. GATHER requires a plain-language description of methods and a fair discussion of limitations. However, researchers and users disagree about what constitutes plain language. Some perceive a frank discussion of limitations to be damaging to the credibility of the estimates.
Communicating estimates
In many cases, agencies do not clearly flag estimates that are largely imputed. And they do not provide full documentation of statistical methods in language that users can understand. Ideally researchers should present estimates with uncertainty ranges or confidence intervals. But the utility of these uncertainties is often not clear to users and decision makers.
For example, for its estimates of mortality by cause, WHO uses a four colour coding system. This system indicates the strength of the underlying data. It also flags whether the models and data have used mainly country-specific data or borrowed strength from other countries or covariates. More discussion is needed as to whether and how uncertainty ranges can contribute to better communication and use of estimates.
Challenges
Multiple global health estimates are now available for many health indicators. One from the UN system and others from academic institutions. This can be of concern to international users such as donor agencies and national governments. Like international rankings, dissonant health statistics can cut both ways. In some cases, they are demoralising. They can undermine the ability or will of donors to invest in programmes whose success is not yet reflected in global statistics. In other cases, they have led to national debate and greater national investment in data collection and analysis.
A critical lesson has emerged from such debate. This is the need for much greater dialog between agencies carrying out global estimates and national authorities. They need to discuss the data limitations and biases being addressed through the global modelling process. They must develop a shared understanding of the strengths and limitations of both the input data and the estimates derived from the models.
Users of health statistics have different data needs. Their perceived credibility and utility of different kinds of statistics vary significantly. National and sub-national data users often prefer empirically measured data that can inform decision-making at subnational and national levels. Such users are less concerned about comparability with other national estimates or international standards. Global users, including international agencies, donors and development partners, value estimates that are comparable across countries and over time. This translates into variations in the types of statistics that are considered most credible at different levels of governance. This, in turn, affects the likelihood that statistics will be used to inform policy.
One challenge for users of these estimates is that each revision typically involves a complete re-estimation of the whole time series – rather than adding new values for recent years. In some cases, these changes to the time series are based on new empirical data and are explainable. For example, child mortality rates that incorporate survey responses with 15 or more years of historical recall. In other cases, changes to the estimation methods lead to substantial differences in the estimated series. This is even though the data may remain the same. This can confuse. For example, if baseline estimates change, with implications for the speed – and even the direction – of time trends and shifts away from or potentially even over final targets. While the differences usually fall within margins of uncertainty, it can be difficult to explain these changes to policy makers.
Globally-produced statistics that differ substantially from country-reported data can be used for political purposes. Governments may use favourable estimates to rally support for current policies. Conversely, unfavourable estimates bolster political opposition and civil society criticisms of the government. This makes it all the more important to ensure greater shared understanding of the reasons for global modelling adjustments to raw input data.
Global health estimates do not replace the need for countries to collect reliable, accurate and regular empirical data. However, using estimates to fill in missing data can mislead users into thinking the empirical data are available, and reduce pressure to improve information systems. Production of estimates remotely, using sophisticated modelling techniques, may also undermine country understanding and ownership of their indicators. In an era of global target setting, there is a danger that predicted statistics may be used for the evaluation of progress. Production of estimates should go hand in hand with development capacity development in countries for data generation, analysis and interpretation.
Contents
Source chapter
The complete chapter on which we based this page:

Mathers C., Hogan D., Stevens G. (2019) Global Health Estimates: Modelling and Predicting Health Outcomes. In: Macfarlane S., AbouZahr C. (eds) The Palgrave Handbook of Global Health Data Methods for Policy and Practice. Palgrave Macmillan, London.
Additional resources
The United Nations and its specialised agencies, such as the World Health Organization and the UN Fund for Children publish annual global and country health estimates for major demographic and health indicators based on data reported by member states. WHO publishes its global health estimates here.
The Institute for Health Metrics and Evaluation (IHME) also publishes annual updates of comprehensive global burden of disease statistical time series. These are based on available data for 195 countries and territories, with subnational estimates for a growing number of countries. (5) The IHME publishes its estimates here.
The WHO produced the 21 page Global Health Estimates Technical Paper WHO/HMM/IER/GHE/2018.4 to accompany global estimates.
Gather Working Group. Guidelines for Accurate and Transparent Health Estimates Reporting: GATHER Explanation and Elaboration
Gelman A, Hill J. Data analysis using regression and multilevel hierarchical models
Gelman A et al. Bayesian data analysis.
Arlot S, Celisse A. A survey of cross-validation procedures for model selection.
Barai S, Reich Y. Ensemble modelling or selecting the best model: Many could be better than one.
Foreman KJ et al. Modeling causes of death: an integrated approach using CODEm.