
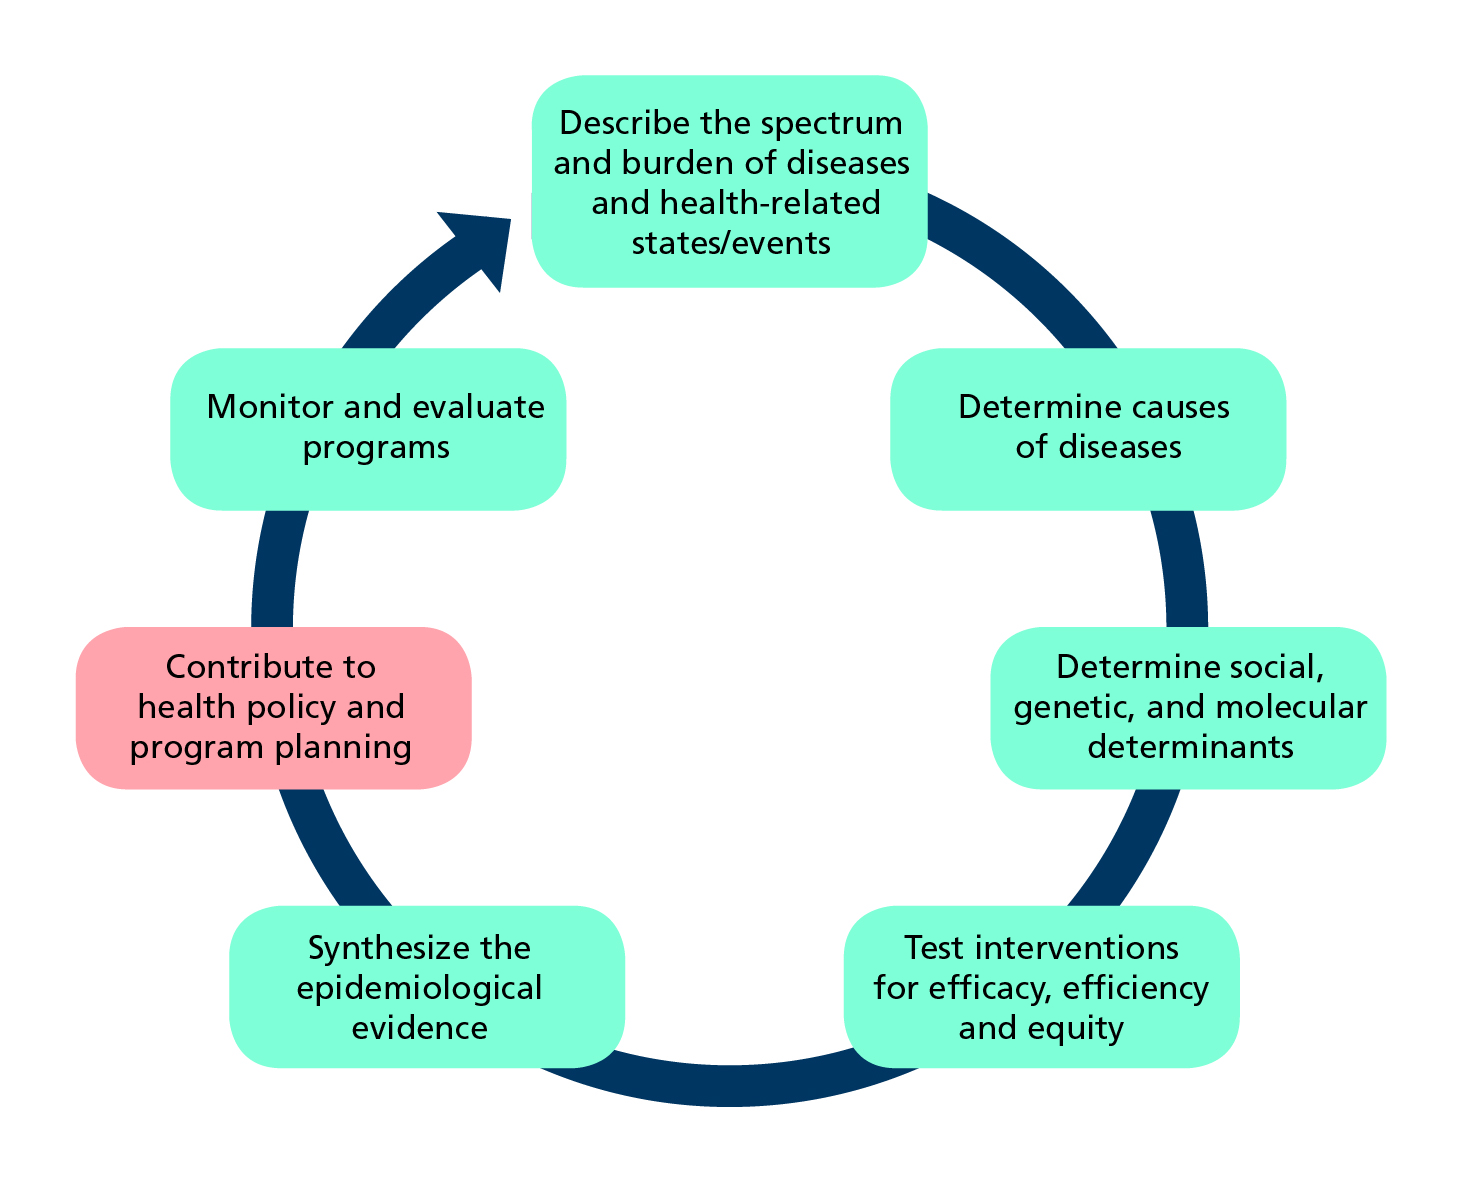
Role of epidemiology in developing health policy and programmes (Adapted from Tugwell et al.)
What is epidemiology?
Epidemiology is the study of how often diseases and other health-related events or states occur in populations, why they occur, and which and how interventions can effectively address health problems.
Epidemiologists observe health conditions among groups of individuals in populations at risk, offer estimates of the severity of the health condition in the population and identify factors and interventions that health programmes can target to prevent and control the condition.
Despite tremendous advances in the discipline of epidemiology, evidence is unevenly produced across the world. Low- and middle-income countries (LMICs), with the highest disease burden, have imprecise estimates of deaths and causes of illnesses. Implementation, evaluation, and scale-up of effective interventions are challenging in many of these countries. The Sustainable Development Goals (SDGs) offer benchmarks to assess progress. The principles of epidemiology provide a basis for developing interventions and for measuring achievement of many of the goals.
The epidemiological approach
Epidemiologists work with others for example, statisticians, economists, social scientists, computer scientists, demographers and most health professionals. They embrace approaches from several disciplines. Specific methods and principles govern how epidemiologists operate. They tailor their approach to answer different types of questions and use the principles of statistics to attach measures of uncertainty to their findings.
Epidemiologists design and use routine systems to collect data that inform everyday public health decision making. They also design studies to answer questions about:
- The spectrum of health conditions (cross-sectional surveys);
- Their potential causes (case-control and cohort studies); or about
- The efficacy, effectiveness, efficiency and equity of proposed interventions (controlled trials).
The study designs and methods they use aim to limit bias and the play of chance, and hence the likelihood of drawing incorrect conclusions.
Routine sources of epidemiological data
An essential function of epidemiology is public health surveillance which we describe on the surveillance page. Field epidemiologists set-up and maintain early-warning systems. They monitor infectious diseases and other health threats so that they can prevent or respond to them in real-time. They undertake surveys to understand disease patterns and conduct rapid case-control studies to determine the cause of outbreaks.
Disease registries are set up to follow individuals who have contracted a specific chronic disease such as cancer and provide information about its incidence , treatment and duration. Health management information systems serve as the data backbone of the health system. They continually provide information about all aspects of healthcare. Civil registration and and vital statistics systems, where they are functional, provide information about births, deaths and causes of deaths.
Sources of epidemiological data to inform health policy and manage programmes |
|||
Method |
Definition |
Use |
Comments |
Public health surveillance |
Continual systematic monitoring of the occurrence of disease/condition in a population using data from different sources. |
Provides managers with ongoing data of the occurrence and distribution of conditions; can provide real-time warning of when and where an outbreak will occur. |
Requires rapid and efficient long-term collaboration to collect and analyse data across health and other sectors |
Disease registries |
Legally mandated systematic registration, in a geographic area, of all individuals who contract a specific chronic disease, with longitudinal follow-up of all relevant events related to each individual. |
Offers detailed information on the incidence and duration, treatment and outcomes of a disease to advise prevention and control policies and programmes. |
Expensive and difficult to follow-up cases especially in low-income countries; requires efficient long-term collaboration across health facilities and multiple professionals to collect and analyse data. |
Health facility records of health events |
Continuous systematic, reporting of the occurrences of health events and mandatory reporting of notifiable diseases. |
Assists public health departments to plan disease control and prevention policies and programs; and contributes to knowledge of global disease patterns. |
Requires efficient and rapid information systems; trade-off between number of diseases to notify and reporting workload. |
Civil registration and vital statistics |
Mandatory continuous recording of all births and deaths (and cause) in a population. |
Supports planning by providing birth and death rates and causes of death. |
Not fully functional in many LIMCs where causes of death are hard to ascertain. |
Dedicated epidemiological studies
In addition to making use of routinely collected data, epidemiologists design studies to answer specific questions.
A good question for an epidemiological investigation is focussed, relevant, meaningful, and builds on what is previously known. To be sure that the question is pertinent, current, and not already answered, researchers review the literature. They look for systematic reviews that critically appraise the validity and applicability of existing evidence. Alternatively, they undertake systematic reviews themselves.
The systematic review is an efficient scientific approach for summarizing the literature. Reviews use explicit and reproducible methods to identify relevant studies, assess risk of bias in studies, extract information and synthesize findings. The process begins with the preparation of a protocol that documents the objectives and proposed methods of the review. Publication of the review protocol in a publicly accessible register such as PROSPERO and the Cochrane Database of Systematic Reviews ensures transparency and avoids unnecessary duplication of effort. Guidelines for the reporting of systematic reviews are available in the form of the PRISMA Statement and its various extensions.
We identify three broad categories of questions relevant to policy and programme management that address:1) the scale of the problem; 2) potential association of the problem with exposure to risk factors; and 3) choice of a treatment or intervention.
Dedicated epidemiological studies to answer specific questions |
||||
Method |
Definition |
Use |
Comments |
|
What is the prevalence of a disease/condition, where and among which groups is it prevalent? |
||||
Cross-sectional study |
Random samples of individuals in a population at a point in time; to describe the prevalence of the disease/condition by other characteristics of the population. |
Informs about the scale, and demographic and geographical distribution of condition/s; repeated surveys can establish trends; generates hypotheses. |
Not useful for rare conditions of very short duration; hard to control for confounding or to attribute causality. |
|
Which are the risk groups and factors associated with the disease/condition that an intervention could target? |
||||
Cohort (longitudinal) study |
Follows a well-defined population over time who are exposed to risk factors of interest; to compare incidence of a disease/ condition in those exposed and in those who are not (relative risk). |
Describes incidence and the course of the condition (prognosis), and identifies risk factors to target for interventions. |
Takes time; not feasible for rare conditions or diseases with long latency; suitable cohorts can be difficult to identify and costly to follow; ethical considerations include confidentiality and privacy. |
|
Case-control (retrospective) study |
Selects a group of cases with a disease/condition and a group of controls without the condition (but otherwise similar) and records history of exposure to potential risk factors in both groups; to examine odds ratio as a measure of association. |
Rapid way to establish (multiple) risk factors to target for interventions; especially for diseases that are rare or have long latency. |
Information collected retrospectively. Prone to confounding and measurement bias; difficult to establish a temporal relationship between risk and development of the condition; selection of a suitable control group can be difficult. |
|
Which intervention to recommend? |
||||
Randomized controlled trial (RCT) |
Randomly assigns consenting participants, groups or communities to an experimental treatment, or to a standard treatment, no treatment, or a placebo; where possible assignment is masked and without the knowledge of treatment providers. |
Provides the best available evidence on the efficacy of treatments. |
Expensive and cumbersome; trade-off between internal and external validity due to selected samples; study of harm is not feasible for ethical reasons; for field interventions findings may not be generalizable beyond the study context. |
|
Quasi-experimental study designs |
Utilizes control groups which are selected or matched, or statistically simulated, to be as comparable as possible to the subjects exposure to the new intervention. |
Most useful when RCTs are either logistically infeasible or ethically unacceptable e.g, to evaluate the effects of legislation, on entire populations. |
Each study design has its pros and cons (especially its risk of failure to control for potential confounders); considerable experience is required to judge the most appropriate design for a given situation. |
|
What is the scale of the problem?
Cross-sectional surveys
Cross-sectional surveys are designed to answer questions about how many individuals suffer from a condition in a population, and who and where they are; and sometimes to answer additional questions about whether there is an association between the health outcome and potential risk factors. Investigators select a random sample from the defined population at a point in time and interview, and sometimes examine, sampled individuals to ascertain whether they have the condition or conditions, and record socio-demographic and other information. They estimate the proportion or prevalence of people having the condition in the population and provide a margin of error.
A prevalence rate is proportion of people in a population who have a condition of interest at a point in time (or, for period prevalence, during a period of time).
What are the risk factors?
Cohort studies
Cohort studies are designed to define and describe a population, and set up long-term mechanisms to observe if and when an individual contracts the condition, and describe their characteristics, including exposure to potential risk factors, geographic, socio-demographic and other determinants, as well as making clinical and laboratory observations.
Incidence rate: proportion of people in a population who contract a condition during a period of time.
Relative risk (RR): ratio of the incidence of the outcome of interest in a risk group to the incidence of the outcome in a comparison group. A RR of one indicates no association between the risk factor and the outcome, a value higher than one indicates positive association, and a value lower than one indicates negative association.
Some cohort studies follow participants prospectively for relatively short times, for example, women followed through their pregnancies; and others last beyond the lifetimes of their investigators, for example the United States (US) Framingham Heart Study has recruited participants since 1948. In some LMICs, researchers maintain demographic and health surveillance sites (DHSS) that have surveyed generations of participants – making it possible to follow cohorts prospectively and retrospectively. In countries with well-established population registries and linked health examination surveys (or suitable health care records) independent researchers can follow cohorts retrospectively and prospectively without setting up their own cohorts.
Case-control studies
For case-control studies, epidemiologists identify a group of cases with the condition, and compare them with a group of controls without the condition. The controls are otherwise similar in most respects, for example, for age group, sex, socio-economic status. They record past exposures to the hypothesized risk factor for cases and controls through interviews, history-taking, or measuring biochemical, serological, or molecular markers.
Odds ratio (OR): ratio of the odds that an outcome occurs in a risk group to the odds that the outcome occurs in a comparison group. For uncommon outcomes, the OR approximates the RR for an association.
In March 2016, after increasing notifications of microcephaly in newborns, investigators in north-eastern Brazil retrospectively compared each of 64 babies born with probable congenital microcephaly between September 1st, 2015 to January 5th, 2016 with at least two newborns delivered in the same hospital without the condition; matching also on residence, week of delivery and gestational age at birth. Paediatricians interviewed by phone those mothers who agreed to participate to ascertain the signs and symptoms experienced during pregnancy, and classified mothers as suspected to have ZIKV or not.
Investigators concluded that ‘Mothers who experienced symptoms associated with the Zika virus during pregnancy had ten times higher odds of delivering newborns with congenital microcephaly when compared with mothers who did not exhibit Zika-like symptoms.’ The investigators pointed out that ‘This knowledge could have helped to limit some of the misguided speculation and could have expedited public health policies more effectively targeting the mosquito vector.’
Which intervention to recommend?
A major use of epidemiological inference is for rigorous evaluation of interventions, for example to assess a new treatment for a medical condition or a new healthcare approach for delivering vaccines. Researchers no longer passively observe what happens. Instead, they set up a controlled situation, or trial, in which they give one group of participants the new intervention and a control group an alternative.
The randomized controlled trial (RCT)
The randomized controlled trial (RCT) is the most rigorous type of intervention study producing the best evidence, that is, with least possibility of biased findings. During a RCT, researchers follow participants to assess how frequently the outcome occurs in two or more groups, and compare these rates.
Measurement of outcomes, for example, as the percentage in each group who survive, their time to recovery, weight gain, and so on. Investigators set out to test the hypothesis that there is no difference in outcome between the groups versus there is a difference of an expected size.
Where feasible, authorities require a RCT before registering drugs and devices or adopting interventions. An essential design element in RCTs is the procedure of randomization in assigning eligible, consenting individuals either to the group offered the experimental treatment, or a control group offered a standard treatment, no treatment, or a placebo (an inactive treatment that appears similar to the experimental treatment).
This procedure ensures investigators allocate participants to treatments by chance, not using any biased assignment method (conscious or unconscious) which would, for example, result in placing participants with different levels of disease severity in the comparison groups. Randomization, is the only method that can ensure that comparison groups are similar apart from the treatment they receive. Investigators can randomize individuals (individually randomized trials) or groups, such as schools, medical practices or communities (cluster randomized trials).
Another characteristic of some RCTs is blinding, that is when investigators ensure that neither the participant nor the treatment provider knows the group to which the participant belongs. Blinding is important when a trial’s outcomes could be influenced by the placebo effect or even by the process of being studied or when the way the outcome is reported or measured could be influenced by knowledge of the treatment received. However, blinding is seldom feasible for trials of interventions that investigators cannot hide from the participants, such as healthcare organizational changes or surgery.
Researchers wanted to know whether community mobilisation improves the effectiveness of the government-run dengue control programmes in three communities in Nicaragua and one in Mexico. They randomised 75 census enumeration areas (clusters) to chemical-free prevention of mosquito control through community mobilisation as well as the government dengue control programme, and 75 control clusters just to the government programme.
Compared to baseline findings, the researchers found significant risk reductions in the intervention over the control group for: dengue infection in children, reports of dengue illness, larvae or pupae in houses visited, containers with larvae or pupae among containers examined and among houses visited. The researchers concluded that ‘Evidence based community mobilization can add effectiveness to dengue vector control.’ But they cautioned that while this was a promising start, sustainability of the community participation might be difficult.
Quasi-experimental designs
Quasi-experimental designs. There are some situations where randomization of individuals or groups is not feasible or ethically problematic. In such instances, investigators may use quasi-experimental designs to assess the effects—both positive and negative.
Implementing the design
The EQUATOR Network provides online resources for writing protocols and reporting for most types of epidemiological studies. Since serious ethical considerations cut through all aspects of design and implementation of studies of people, investigators must gain approval from nationally approved institutional review boards.
For data management and analysis, we suggest the reader explore the open software Epi Info™ developed by the US Centers for Disease Control and Prevention. Epi Info™ provides customized tools for data entry and analysis, with excellent visualization including maps; it also supports development of small disease surveillance systems.
We highlight three critical aspects of study design:
Participant selection
Statistical inference usually assumes that the investigator chooses participants at random. Simple random sampling is not often feasible or appropriate, so epidemiologists use other methods, for which, as in random sampling, there is a known probability of the participant being selected. For cross-sectional studies, these methods include: stratified sampling in which the population is stratified by, for example sex or age, followed by random sampling within these strata; and cluster sampling in which investigators sample clusters from a population partitioned into homogeneous groups (or clusters), such as enumeration areas, villages or schools.
For cohort and case-control studies and surveys, investigators may select participants systematically or use sequential sampling, that is they select elements from the source population based on a random starting point, and then use a fixed interval (usually based on sample size) to select all other elements. Explicit inclusion and exclusion criteria should define the target population and eligible participants. Specific working definitions for these criteria will minimize misclassification of participants, particularly in designs requiring comparison with a control group.
Measurement accuracy
Disease status can be ascertained by: examining participants for symptoms and signs consistent with the disease or event, using diagnostic laboratory tests; administering questionnaires or conducting interviews; or reviewing medical records, sometimes by linking subjects from different administrative or research databases.
Accurate measurements are essential to assess exposure. Accuracy requires, for example, direct laboratory assays for exposure (such as hepatitis B surface antigenaemia among patients with hepatocellular carcinoma), careful interviews of cases, or surrogate information from several sources, and using standardized questionnaires to minimize recall bias. To ensure proper data quality, investigators can conduct pilot studies, monitor and supervise procedures, employ laboratory quality assurance, and commission periodic audits of long-term studies.
Sample size
Epi InfoTM includes a sample size calculator, which addresses the aim of the study, the type of study and the chosen sampling method.
If the aim is to estimate an indicator – a prevalence rate, for example – the investigator specifies a margin of error, or width of confidence interval they expect to obtain. The investigator also makes a guestimate of the value that the indicator is likely to take – by looking at values in the literature for similar populations or by doing a pilot study. The smaller the intended margin of error, the larger the required sample size.
To test a hypothesis, the investigator needs to specify:
- The magnitude of a minimum detectable but clinically meaningful difference in the outcome they expect between the exposed and non-exposed groups;
- The probabilities of wrongly concluding there is a difference (a so-called Type I error – say 5%); and
- The probability of wrongly concluding there is no difference (a Type II error – say 20%).
The smaller the difference the investigator is seeking to detect, or the lower the investigator sets either of the two error probabilities, the larger the sample size.
When epidemiologists present their results, they and their audiences must be satisfied that their findings answer the question they set out to address. They check for bias, and confounding, two well-used terms in epidemiology. They also explain random variation (the play of chance) in their findings and how this affects interpretation.
Drawing conclusions
Is there any bias?
Bias is the extent to which a study systematically underestimates or overestimates the indicator described or the association reported between exposure and the outcome. The most common types of bias are selection and measurement bias.
Selection bias
- In cross-sectional studies when sample members do not represent the population to which the investigator hopes to make inference, perhaps because they did not select the sample at random or because they did not sample from the entire population. Researchers may draw their sample from the wrong population. For example, if they want to estimate the prevalence of hypertension in the general population but draw their sample from patients attending an outpatient clinic or in an emergency room visit.
- For case-control or cohort studies, poor representativeness may not necessarily lead to bias, unless there is differential sample distortion with respect to exposure and outcome. In case-control studies, prevalent cases of long duration may have different risk-factor profiles than cases who have died early and are not represented in the selection process.
- In clinical trials, selection bias arises when there are systematic differences between treatment groups in factors that can influence the study outcomes being measured (confounding variables. Randomization stands alone in its ability to control for differences in both known and unknown factors that can influence treatment outcomes.
Measurement bias
- Measurement bias occurs through errors in recording observations, participant recall bias, instrument bias, and misclassification of exposure and disease status. In RCTs knowledge of treatment assignment could lead to systematic differences in how health care providers or researchers manage participants in comparison groups (performance bias) or in how investigators or patients themselves assess outcomes in these groups (detection bias), or both.
Is there any confounding?
A confounder is an extraneous variable (not part of the purported chain of causality between exposure and outcome), often unobserved by the investigators, that distorts the relationship between exposure and the outcome of interest. Confounding happens when the third variable is associated with the exposure while also being a potential cause of the outcome.
The figure below illustrates how previous history of cigarette smoking might confound an investigation into the association between periodontitis and development of cardiovascular disease. An observed association between periodontitis and cardiovascular disease could be entirely because long-term smokers have an elevated risk of both conditions.
Researchers should consider all plausible potential confounders, design their studies to avoid confounding, and analyse data to account for the possibility of confounding.
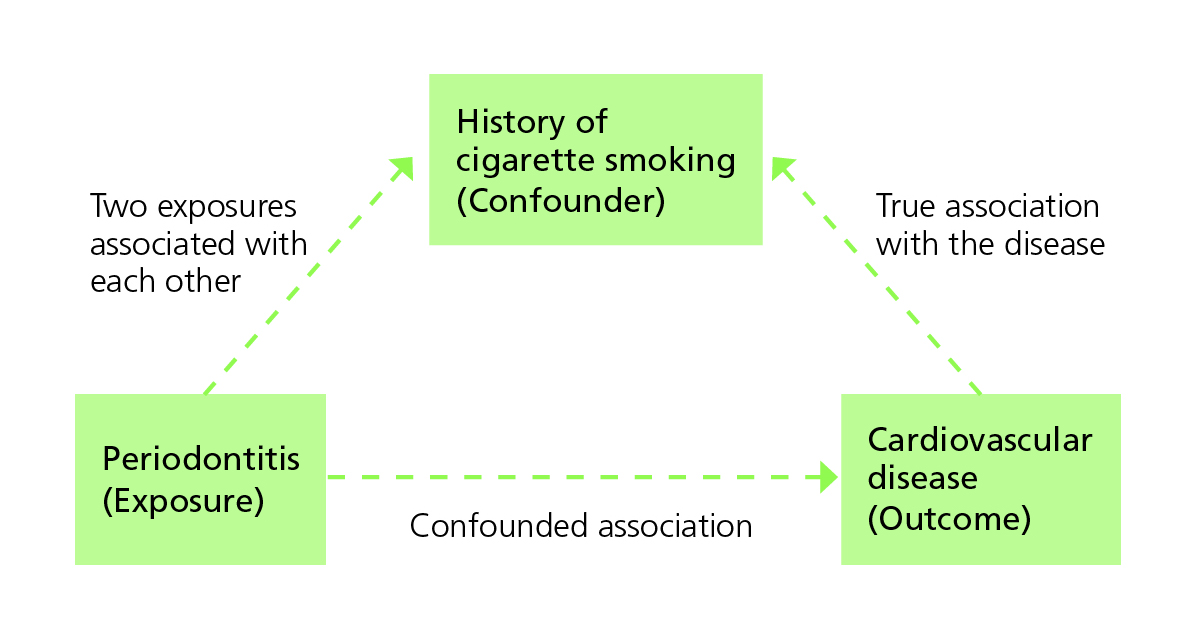
Cigarette smoking as a confounder of the relationship between periodontitis and the development of cardiovascular disease (Adapted from Bonita et al.)
Are the results due to chance?
One of the main reasons for taking random samples is to avoid bias. Random sampling also means that investigators can interpret results against what might have happened by chance.
Confidence interval: Most studies report a 95% confidence interval around their estimate of the indicator of interest. Assuming that investigators selected participants at random, statistical theory tells us that if the study were replicated many times, on 95% of occasions, the calculated interval would contain the true population value of the indicator. That is, there is a 95% chance that the calculated confidence interval contains the true indicator and a 5% chance that the interval does not contain it at all. The smaller the sample size the wider and less informative the interval.
Significance test: When the investigator has set out to test a hypothesis, for example that there is no difference between two treatments versus there is a difference, the conclusion will be either to reject the hypothesis or not. When investigators report that a difference is significant at the 5% level, they mean that: assuming they selected participants for treatment allocation at random and the hypothesis were true, there is only a 5% chance that the observed difference between the two treatments would occur by chance.
That a difference is statistically significant does not mean that it is meaningful. Users must interpret the finding in the context of the study and with some understanding of the possible mechanisms leading to the difference.
For example, a very large trial of a new anti-hypertension drug might find a difference of only 0.1 mm Hg, between patients’ average blood pressures in the two treatment arms, to be statistically significant (i.e. p<0.05). However that difference is not biologically/clinically significant – mainly because it is well within measurement error in standard clinical practice, where we can realistically only detect differences of at least a few mm Hg in blood pressure.
Does evidence of an association mean there is evidence of causality?
Having demonstrated an association, researchers may want to conclude that a risk factor or treatment causes the health outcome. In the ZIKV case-control study, researchers established a strong association between mothers who experienced symptoms of ZIKV during pregnancy and delivering babies with congenital microcephaly. Could they also conclude that ZIKV caused the microcephaly?
To establish causality after showing association, researchers need to:
- Satisfy themselves that potential biases have not importantly influenced their conclusions;
- Demonstrate that the risk factor occurred before the health outcome;
- Exclude spurious explanations for the association; and
- Describe a plausible chain of causality between the risk factor or treatment and the outcome.
In the ZIKV study, researchers described credible attempts to avoid bias but listed as limitations: potential mothers’ recall bias; and lack of and incomplete laboratory test results for other pathogens that could lead to microcephaly. They could establish that the signs and symptoms occurred before the women gave birth but not necessarily before conception; nor could they rule out other viruses (such as dengue or Chikungunya) as the cause of the mothers’ symptoms. So they concluded only that there was an association between ZIKV-like symptoms during pregnancy and giving birth to a newborn with congenital microcephaly.
It is difficult to establish a temporal relationship between risk and development of the condition for case-control studies. RCTs provide the best form of evidence of causality. But – as we pointed out above – may not always be logistically or ethically feasible, as in this case.
Challenges
Obtaining definitive answers to the kinds of questions policymakers ask is seldom straightforward. Findings depend on the question, choice of design, and context of the study; and they are subject to chance.
Decision makers become frustrated when different studies come to different conclusions. They want to know, once and for all, the causes of a disease or that a treatment or intervention will lead to good outcomes. The perfect study design is rarely possible. Scientists should critically appraise their choices and findings, and those of others; and users must understand that most studies are only indicative and must be complemented by a combination of different types of studies with synthesis over time to produce consensus.
Contents
Source chapter
The complete chapter on which we based this page:

Lansang M.A., Dennis R.J., Volmink J., Macfarlane S.B. (2019) Epidemiology for Policy and Programme Management. In: Macfarlane S., AbouZahr C. (eds) The Palgrave Handbook of Global Health Data Methods for Policy and Practice. Palgrave Macmillan, London.
Additional resources
Systematic reviews
Glasziou et al. Systematic reviews in health care: a practical guide.
Khan et al. Systematic reviews to support evidence-based medicine.
Introduction to epidemiology
Bonita et al. Beaglehole R, Kjellström T. Basic epidemiology
Epidemiological designs
Rothman K. Epidemiology: an introduction.
Rothman K et al.Modern epidemiology.
Manja V, Lakshminrusimha S. Epidemiology and clinical research design, part 1: study types.
Randomized control trials
Jadad AR, Enkin MW. Randomized controlled trials: questions, answers and musings.
Pocock SJ. Clinical trials: a practical approach.
Altman DG, Bland JM. How to randomize?
Quasi-experimental designs
Sanson-Fisher RW et al. Evaluation of systems-oriented public health interventions: alternative research designs.
Frank J et al. Disease prevention: a critical toolkit.
Quality of evidence
Haynes RB et al.Clinical epidemiology: how to do clinical practice research.
Dans AL et al. Painless evidence-based medicine.
Latest publications