
Why health economics?
Economics uses and creates data that inform policy. Health economic analyses incorporate data from other public health disciplines, such as indices of disease prevalence and intervention efficacy. The analyses produce quantitative estimates of disease burden, costs, and cost-effectiveness which help policymakers prioritize diseases to target, and choose between intervention strategies to maximize health gains with available resources.
Policy-relevant questions that economists can answer include:
- What does it cost to treat one person with a specified disease? Per cure? Per added year of life?
- What does it cost to deliver a prevention strategy? What is the estimated cost per case of disease averted?
- What is the most efficient balance of prevention and treatment strategies, for specific population groups and across the entire population?
What is health economics?
Health economists view health systems as economic systems in which healthcare and public health providers are the suppliers and individuals the consumers (and presumed beneficiaries), each making choices with limited resources and with goals of maximizing income or health status for themselves or for populations. Policymakers intervene in the system to achieve societal and political goals. Economists have the tools to assess these dynamics and measure their effects on populations and individuals, for small and larger portions of the system.
When decision-makers consider alternative public health policies, they are often interested in how the respective implementation costs of these policies compare with expected benefits to society. Whereas other researchers propose and demonstrate the health benefits of specific interventions, economists consider the costs of actually implementing these interventions and the expected benefits in real-world operation.
The range of methods which health economists combine or apply include:
Econometrics
This statistical arm of economics aims to reveal and quantify causal relationships that drive economic systems, such as socio-demographic factors that determine utilization of medical services, lifestyles that influence longevity, or programme design features that determine intervention cost. Several econometric methods (for example, instrumental variables and regression discontinuity design) are especially effective at confirming causality by ruling out self-selection and other reverse causality (known as endogeneity).
Cost-benefit analysis
Cost-benefit analysis (CBA), which derives from the academic field of social welfare, assesses if a particular economic activity is worthwhile in monetary terms. CBA can demonstrate the economic returns of investment in an intervention, compare the costs and benefits of alternative interventions, and help policy-makers allocate budgets. CBA compares the costs of production (for example, of health services) with the monetary value that society places on the outcomes (for example, the value of averted costs in health and other areas, or willingness to pay for improved health status).
Cost-effectiveness analysis
Cost-effectiveness analysis (CEA), used widely in health, assesses the cost of an intervention per unit of health gained. The cost component (the numerator) is the same as cost in CBA. However, the effectiveness component (the denominator) is expressed in health units – clinical events (for example, deaths or illness episodes), other health outcomes (for example, new infections), or, ultimately and preferrably, a metric that quantitatively combines morbidity and mortality, such as disability-adjusted life years (DALYs).
Micro-costing
Micro-costing quantifies resources and associated costs needed to deliver a set of services, such as a prevention or treatment intervention. Micro-costing is the standard of practice to characterize costs usually from the bottom up, and permits an excellent view into the production process. An important distinction: price is what buyers pay to sellers for a service or commodity, whereas cost represents the amount put into production. The difference is profit.
Behavioural economics
Behavioural economics merges cognitive psychology and economics. It uses insights from the study of human motivation to design strategies to foster healthier behaviours or better clinical practices. Specific topics include the role of mental short-cuts (our quick instinctive reactions to situations we encounter), framing (how a choice is posed), and incentives (for example, monetary rewards or internal norms).
Discrete choice experimentation
Discrete choice experimentation elicits preferences about potential actions (for example, choice of a health clinic). Methods to explicitly ask individuals about their preferences may be inaccurate, distorted by social desirability (saying what is perceived as acceptable) and other cognitive biases. Instead, the discrete choice approach observes the choices, and then uses statistical techniques to infer what attributes (for example, cleanliness, politeness, or drug stock) drive the choices. Thus discrete choice methods reveal actual rather than stated reasons for choices.
Financing
Financing addresses how funds are raised, for example, from taxes and insurance premiums, and how they are distributed to providers, for example, via fee-for-service or capitation. Thus, financing characterizes how money moves through, and lubricates, the economic system.
Labour or workforce economics
Labour economics describes the professionals, for example, doctors, clinical officers, and nurses, who perform the services required for the health system to function. This is the biggest (most costly) supply component of health systems. Projections of workforce need and training are critical to prepare for future health care needs.
Measuring the burden of disease
For economic analysis, a preferred measure of health benefits is one that researchers can compare across locations, over time, and by disease categories. Some studies use summary measures of health status such as life expectancy, infant and child mortality; others use disease-specific disease incidence or prevalence. Ideally what is needed is a single summary metric that comprises health gains regarding both deaths averted and reductions in adverse non-fatal health states.
Work in this area started during the 1970s with the QALY (Quality-Adjusted Life Years) and the DALY (Disability-Adjusted Life Years) which was introduced in the 1990s. The DALY and the QALY are the converse of each other: DALYs measure burden of disease and QALYs measure health.
The DALY
The DALY is the metric used for the development of global and national/subnational burden of disease estimates. IHME publishes the Global Burden of Disease (GBD) Study, and the WHO produces similar estimates.(19)
One DALY represents one year of healthy life lost and the measured disease burden represents the gap between a population’s health status and that of a normative reference population. The DALY for a specific condition is calculated as the sum of the years of healthy life lost from premature mortality due to the condition (the mortality component, YLL) and the years of healthy life lost due to disability due to that condition (the morbidity component, YLD). That is,
DALYs = YLLs + YLDs
YLL, the mortality component
YLL, the mortality component is calculated as the number of deaths in the year due to the condition multiplied by the years lost from premature mortality from the condition, based on normative life tables that represent the potential maximum life span of an individual in good health, not exposed to avoidable health risks or severe injuries, and receives appropriate health services. (See the World Health Organization document) Because of anticipated continuing increases in life expectancy, many burden of disease estimates will rely on frontier life expectancy projections, such as those for the year 2050 by the World Population Prospects 2012.
Numbers of deaths by age and sex in a given country can be obtained from civil registration records, or estimated from the census, or household surveys. Information on deaths due to specific conditions may be available from vital registration or estimated from health facility data. Life expectancy data can be obtained from country- and age-specific life tables, and are used in many disease models for cost-effectiveness analysis. However, these do not provide a normative standard for global comparison.
YLD, the morbidity component
YLD, the morbidity component, was originally calculated as the number of disability cases in the year (incidence) multiplied by their average duration and by a disability weight that reflects severity of the disease on a scale from 0 (perfect health) to 1 (dead). Since 2010, the GBD Study uses prevalence instead of incidence multiplied by duration.
YLD can be calculated as the number of people living with the condition (prevalence) in a given year multiplied by the disability weight for the condition. Prevalence data can be obtained from household studies or facility records in the country, or modelled on data from countries in which the prevalence is thought to be similar. The IHME publishes disability weights which it estimates by interviewing thousands of people (in-person and online), and asking them to rank the health status of two hypothetical individuals (See Salomon JA. et al). The underlying concept of disability thus is operationalized as respondent preferences for different health states.
Age-weighting and time-discounting
Economists previously include age-weighting and time-discounting in the DALY calculation. Since 2010, after consulting philosophers, ethicists, and other economists on the value choices they should incorporate into the DALY calculation, the GBD Study has chosen not to discount for time or use age weights. Most cost-effectiveness analysts still discount DALYs, but no longer use age-weighting. WHO provides a detailed account of the methods and sources for calculating GBD 2000-15. In practice, because many countries lack detailed data on mortality and prevalence by age, sex and cause, estimation of DALYs generally involves complex data collection and analysis or modelling.
Cost-effectiveness analysis
This is the most widely-used tool of economics to inform decisions in health policy.
Basic principles
We all like being healthy; it makes us feel good. Health also leads to wealth. There is very good evidence that populations that are healthier develop more wealth.(see Jamison et al)) This is a reinforcing cycle, since wealth also leads back to health. Thus effective health interventions increase happiness and wealth. It seems obvious from this hypothesis that we would like to implement every effective health intervention. The problem is, this is impossible. We do not have the time or money to provide every possible intervention. When we choose one intervention we lose the option to do other. This is called the opportunity cost: the resources we use for one activity result in giving up another activity with its benefits.
We all work with budgets – whether personal, household, or even national. Thus we know that resources are finite and we can allocate them to a multitude of priorities. Hence situations where we can’t do everything are common. This implies the need to make informed decisions about how to spend the scarce resources that we have.
In most situations, the guiding principle is that we choose interventions that provide the most health benefits with available (or attainable) resources. In other words, we aim for efficient use of resources, measured in terms of cost per health outcome (e.g. cost per year of healthy life added). Understanding efficiency in this way is critical to making the right choices. Final investment decisions often also consider priorities – such as a desire to address inequities or to deliver on political commitments. However, the starting point for resource allocation – and often the primary driver – should be the optimization of resources to maximize health.
When to use a CEA
Consider the example of a policymaker trying to optimize the cardiovascular health of her population. Should she invest in getting more patients with heart disease on low-cost, moderately effective cholesterol-lowering drugs called statins, or get the highest-risk patients on more advanced therapies that are highly effective but also very expensive? Note that the consideration here is not simply of the medication costs, but also costs associated with delivering the medication (for example, provider time) and any side effects associated with the medication. A sound analysis should also consider the savings that accrue from averted heart attacks or strokes among persons receiving cholesterol-lowering therapies. How do we address these apparently competing priorities?
CEA is the primary tool for comparing the incremental cost of adopting a health intervention with the expected health gains. CEA examines competing action options taking both costs and health consequences into account in a systematic way. For example, a CEA of lab monitoring of anti-retroviral therapy for HIV compares the costs of the tests (for example, CD4 and viral load counts) to the changes in observed mortality and associated DALYs averted. By quantifying tradeoffs between resources consumed and health outcomes achieved with the use of specific interventions, CEA can help health planners, insurers, government agencies, and individuals to prioritize services and to allocate health care resources in more optimal ways.
Contemporary CEAs synthesize data from disparate sources: clinical trials, medical and death registries, government records such as vital statistics, as well as, depending on the question being asked, local information about costs and health outcomes. To facilitate comparisons within and across health systems, a standardized set of analytic methods have been developed, ensuring that the method is valid, logically consistent, credible, and applied consistently. Several authors have described the general approach for performing a CEA. We review the methodology, provide examples of CEAs in action, and discuss their limitations. We make the argument that a meticulous and transparent CEA can, despite limitations of the methodology, greatly enhance the returns on investment in health.
Several authors have described the general approach for performing a CEA.
- Drummond et. al. Methods for the economic evaluation of health care programmes.
- Weinstein MC, Stason WB. Foundations of cost-effectiveness analysis for health and medical practices.
- Sanders GD et al. Recommendations for conduct, methodological practices, and reporting of cost-effectiveness analyses: second panel on cost-effectiveness in health and medicine.
- Garber AM. Advances in cost-effectiveness analysis of health interventions.
- Weinstein MC et al. Recommendations of the Panel on Cost-effectiveness in Health and Medicine.
Undertaking a CEA
The first step is to identify the intervention assess, as well as one or more comparison interventions. For instance, in examining community outreach for vaccination against Human Papillomavirus to reduce cervical cancer, we could compare the current status quo (no outreach for vaccination) or an alternative strategy that improves the quality of screening for early cervical cancer detection. For a CEA to be informative, the comparators must represent meaningful alternatives that is, the alternatives the decision-maker would consider feasible and promising.
Incremental Cost Effectiveness Ratio
Since the cost-effectiveness of an intervention is always defined relative to an alternative and depends on choice of comparator (or comparators), it is essential to include all meaningful alternatives in the analysis. CEA most commonly uses the ratio of incremental cost to incremental effectiveness, the Incremental Cost Effectiveness Ratio (ICER,) to compare one strategy (A) to an alternative (B)
ICER = [Net Cost B – Net Cost A] / [DALYs A – DALYs B] or
ICER = [Net Cost B – Net Cost A] / [QALYs B – QALYs A]
- The numerator (incremental costs) typically includes all costs related to the intervention as well as any additional costs (for example, side-effects) or savings (for example, from avoided hospitalizations downstream).
- The denominator (incremental outcomes) typically includes some measure of survival and change in quality-of-life, but may also be simplified to the number of clinical events averted.
- The ICER is therefore an estimate of cost per unit health effect achieved by using a particular health intervention, compared with a specified alternative action.
- Note that the order of subtraction in the denominator depends on whether the study uses QALYs or DALYs; the goal of an intervention would be to gain QALYs or avert DALYs.
- ICER numerator data on costs for each strategy
To estimate net health care costs, we must start by estimating the costs associated with the strategies under consideration. Typically, costs include ‘all direct medical and health care costs (related to the condition under study) which includes costs of hospitalization, physician time, medications, laboratory services, counseling, and other ancillary services,’ including costs ‘associated with the adverse side effects of treatment,’ and ‘savings in health care, rehabilitation and custodial costs due to the prevention or alleviation of disease.’
Recently, the 2nd U.S. Panel on Cost-Effectiveness in Health and Medicine proposed also including: a) costs associated with lost productivity related to the disease for the patient and caregivers; and b) background health care costs related to any improved survival.
Economists may estimate costs from a review of prior published research or through prospective collection of cost data. Often key cost inputs, such as the lifetime cost of treating HIV or the cost of malaria treatment, are readily available in published academic literature and government policy documents. However, when two similar interventions are compared, for example, community versus health facility-based screening for cervical cancer, precise comparison requires prospective data collection. They commonly use micro-costing.
ICER denominator data on health outcomes
Data for health outcomes fall into three categories:
- Reliable data on disease incidence and/or prevalence. These are usually derived from published studies and government health statistics. For example, for HIV available data typically include HIV prevalence surveys for low and high risk populations, and estimates of incidence from cohort studies and disease modelling.
- Some measure of effectiveness for each of the interventions under consideration. We may not know this parameter precisely, particularly for new interventions or when we are trying to model effectiveness over the long-term. The main source for this information is systematic reviews and scrutiny of important new studies. The authors have developed a meta-synthesis approach for all interventions for selected diseases in What Works Reviews. Some CEAs link to specific clinical trials, which then provide the necessary effectiveness estimates.
- The quality-of-life or disability weight associated with each outcome. These parameters have been worked out better for some countries than others. The Global Burden of Disease study has created a compendium of estimates to facilitate international comparisons. Our preference is to rely on these numbers unless better estimates for a given country or condition are handily available. As we described above, when the GBD estimates align poorly with health states in the analysis, it is acceptable to rely on empirical measurements of health state utility or a functional status-based metric.
Time frame in CEAs
An intervention can alter both costs and health effects long after it is administered. The standard recommendation is to calculate or estimate all future costs and health effects in a CEA. Traditionally, this has been limited to those costs and effects related to the disease under study, though the newest recommendation proposes a wider perspective. Limited time frames can be misleading, though long time horizons may require uncertain extrapolation of costs and health effects.The concept of discounting helps with long-term projections that take into account time preferences and alternative uses of money.
Sensitivity analyses
Uncertainty in input parameters may alter the conclusion of the CEA. For instance, a higher drug price or lower efficacy will make the treatment ICER higher (less attractive). We examine the effect of uncertainty using sensitivity analyses. By varying one or more parameters across a range of plausible values, these analyses examine whether changing the value of the input parameter(s) alters the conclusion. One-way sensitivity analyses vary one input at a time, typically yielding a graph of the ICER on the vertical axis and the varied input parameter on the horizontal axis. Two-way sensitivity analyses vary two inputs, generating a set of roughly parallel lines.
We can summarise a large number of one-way sensitivity analyses in tables or in a figure, such as a spider chart, that visually shows the outcome values as each input varies. The spider chart below (from Kahn 2006) shows that for adult male circumcision to prevent HIV, the most important factors determining cost-effectiveness are the protective effect, the cost, and the HIV infection multiplier due to epidemic effects. Finally, multi-way sensitivity analyses use Monte Carlo or similar methods to simultaneously and stochastically examine all inputs, yielding a distribution of results, typically following a normal distribution.
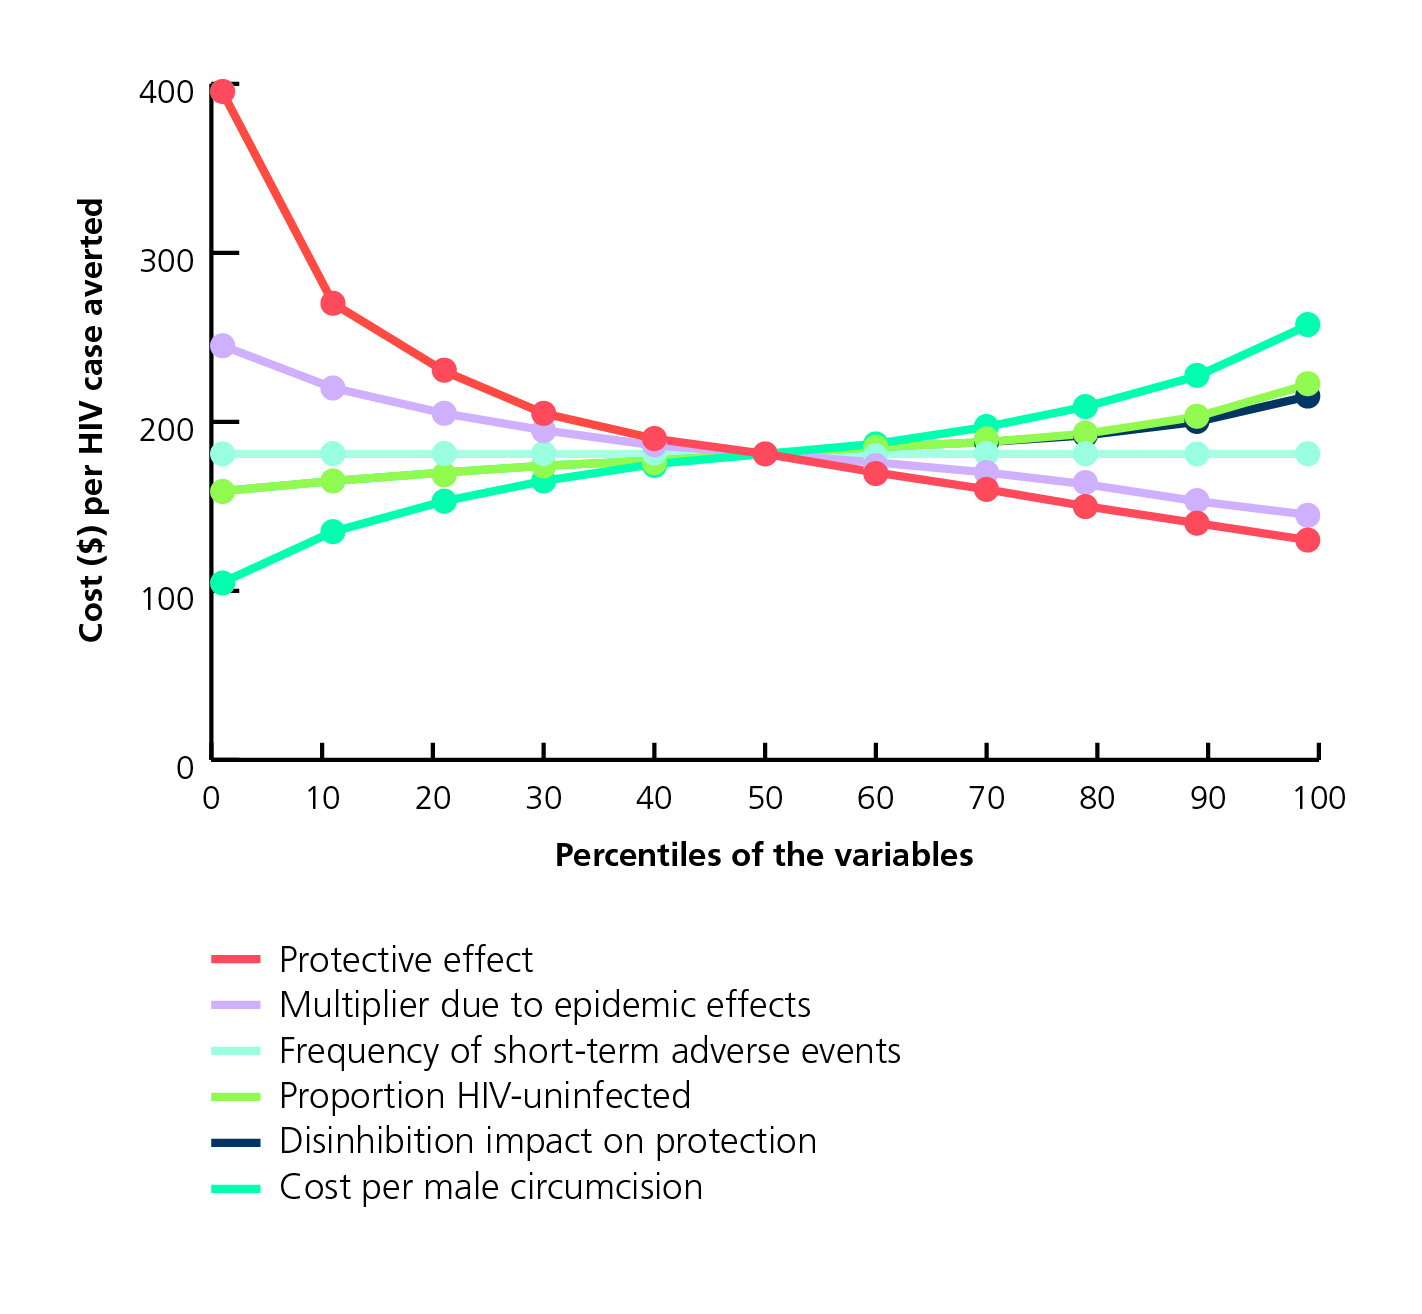
Oneway sensitivity analysis of the cost per HIV infection averted unadjusted for anticipated averted HIV treatment expenditures, South Africa 2006 (Kahn JG et al.)
The 50th percentile corresponds with the base case. Similarly, the first and 99th percentiles approximate the low and high end ranges. For example, the high-end cost per male circumcision corresponds to the 99th percentile, or $250 per HIV infection averted. The figure indicates that the unadjusted cost per HIV infection averted is most sensitive to uncertainty in the male circumcision protective effort, cost per male circumcision, and epidemic multiplier.
Choosing between strategies
We can use the ICER to select an intervention strategy. Most simply, we examine if the added cost per added health gain is acceptable. We first look at interventions one-by-one. If an intervention improves health at a cost of $50,000/DALY, should it be adopted? How about $5,000 per DALY? The current practice is to use a threshold – if the ICER is below the threshold, the strategy would be considered cost-effective. Such a threshold may vary by country and context.
WHO suggests using annual GDP per capita to define a threshold. Consistent with this, in the US, strategies that come in with an ICER <50,000 per DALY averted are usually considered very cost-effective and strategies that exceed $150,000 per DALY are considered not cost-effective, though no formal examination of the threshold has occurred. Threshold values like this have downsides. Most notably, this approach fails to consider all available intervention options, and also ignores the revealed preferences of current practices. Thus, a rote threshold may squander an opportunity to use the new information to improve current spending patterns.
League of tables
An alternative approach relies on the creation of league tables, which rank strategies based on ICERs (the term derives from football, where tables display team rankings). By compiling a league table of ICERs from the literature, we can examine how the ICER of the intervention under study compares with those of other interventions that society has already deemed worthy of investment.
If the ICER is low, the intervention is termed a good value, while if the ICER is high, it is identified as a poor value relative to other accepted interventions. The league table approach also has limitations, as argued by Birch and Gafni. For example, the studies summarized in the table may not use comparable data for costing or efficacy, and some of the CE ratios may not be properly incremental. Further, division of interventions into those with relatively good and relatively poor value depends highly on the specific alternatives displayed in each table. Authors of this chapter are working on potential refinements to methods to interpret and use ICERs to inform policy.
Dominance
We must add a few words on dominance. By going down the list and comparing each intervention with the prior one on the list, we can determine if any intervention is strictly dominated, i.e., less effective and more costly than the prior intervention. Such an intervention would not make a sound investment, since it is more expensive and less effective, and we can eliminate it from further consideration. We can then calculate the ICERs between each adjacent pair of remaining interventions. We can also eliminate interventions that are less desirable by extended dominance.
Extended dominance occurs when the ICER falls as one moves down the results table. In the example the table, going from intervention A to B has an ICER of $200 per DALY averted, but going from B to C has an ICER of $100 per DALY averted. When this occurs, a linear combination of alternatives A and C will be cheaper and better than alternative B. After we have eliminated relevant strategies by extended and strict dominance, ICER, we can examine each strategy relative to the prior strategy. We can then interpret the ICERs as above.
| Example of handling dominance in a cost effectiveness analysis | |||||
| Intervention | Cost | Added cost | DALYs | DALYs averted | ICER ($ per DALY averted) |
| No treatment | $100 | n/a | 3 | n/a | n/a |
| Drug A | $150 | $50 | 1 | 2 | $25 |
| Drug B | $160 | $10 | 1.5 | -0.5 | dominated |
| Drug C | $200 | $50* | 0.8 | 0.2* | $250 |
| * Drug C is compared with Drug A because Drug B is dominated. | |||||
Limitations of CEA
The analyses are often limited in scope and do not evaluate all potential options, even within a given programme.(43) For example, a behavioural intervention aimed at STI-related risk reduction that is not cost-effective in women aged 18–40 years might be cost-effective to those aged 18–24 years.
Most interventions (both behavioural and screening) fail to consider the complete set of alternative uses of resources available to programmes because of data limitations, often limiting the focus to an intervention under study in relative isolation.
Accurately determining intervention cost can be challenging for programmes which frequently lack line-item cost data for factors such as building space and other difficult costs to define (for example, the amount of administrative staff effort to be apportioned to a given intervention).
For some CEAs, factors such as patient, transportation and lost productivity costs are especially important. For some it can be difficult to incorporate all outcomes associated with an intervention, whether they are beneficial or harmful.(see Maciosek et al).
Ethical considerations in CEA
There are many issues to consider when balancing costs and fairness. Some perceive that representing human life in dollar terms and choosing among life-saving interventions based on return-on-investment metrics, cost-effectiveness analyses conflicts with ethical principles such as human rights, equity and the expression of empathy.
We argue, to the contrary, that the utilitarian framework underlying CEA generally provides ethically trustworthy guidance. This is because, in the context of health care delivery, efficiency is itself a laudable ethical value. That is, it is hard to justify not maximizing health with the resources available. In addition, non-utilitarian based principles are, in practice, often hard to interpret, contradictory, or likely to lead to outcomes that diverge dramatically from that of health maximization (See Macklin R, Cowan E.).
Human rights assertions, for example, can conflict with the Rule of Rescue – ‘the imperative people feel to rescue identifiable individuals facing avoidable death’ or other principled claims based on urgent need. We do not believe that utilitarianism is the only legitimate guide to resource allocation decisions. There may be instances, for example, when distributive goals should take precedence. However, efficiency should be the default.
A decision to diverge from health maximization in pursuit of other ethical values needs to be acknowledged and justified. Where possible, we advocate for quantitative assessment of the trade-off between health benefit and other ethical principles. Specifically, what increase in disease burden results from favouring another ethics-based goal?
Contents
Source chapter
The complete chapter on which we based this page:

Kahn J.G., Mwai D., Kazi D., Marseille E. (2019) Health Economics: Tools to Measure and Maximize Programme Impact. In: Macfarlane S., AbouZahr C. (eds) The Palgrave Handbook of Global Health Data Methods for Policy and Practice. Palgrave Macmillan, London.
Additional resources
This video presents a 10-minute introduction to DALYs
The International Decision Support Initiative (iDSI) provides support for colleagues working in low- and middle-income countries.
The Global Health Cost Consortium (GHCC) develops reference cases for cost-effectiveness and cost-benefit analysis and will guide individuals to appropriate technical resources and assistance.
The Lancet Global Burden of Disease.
World Health Organization. WHO methods and data sources for global burden of disease estimates 2000-2015.
United Nations Department of Economic and Social Affairs Population Division. World Population Prospects: The 2012 revision, highlights and advance tables.
Salomon JA et al. Disability weights for the Global Burden of Disease 2013 study.
Bognar G. Age-weighting. Economics and Philosophy.
Drummond MF et al.Methods for the economic evaluation of health care programmes.
Weinstein MC, Stason WB. Foundations of cost-effectiveness analysis for health and medical practices.
Sanders GD et al. Recommendations for conduct, methodological practices, and reporting of cost-effectiveness analyses: second panel on cost-effectiveness in health and medicine.
Garber AM. Advances in cost-effectiveness analysis of health interventions.
Weinstein MC et al. Recommendations of the Panel on Cost-effectiveness in Health and Medicine.
Global Health Decisions. Evaluating what works reviews
Keeney RL, Raiffa H. Decisions with multiple objectives: preferences and value trade-offs.
Karlsson G, Johannesson M. The decision rules of cost-effectiveness analysis.
World Health Organization. Making fair choices on the path to universal health coverage. Final report of the WHO Consultative Group on Equity and Universal Health Coverage