
. 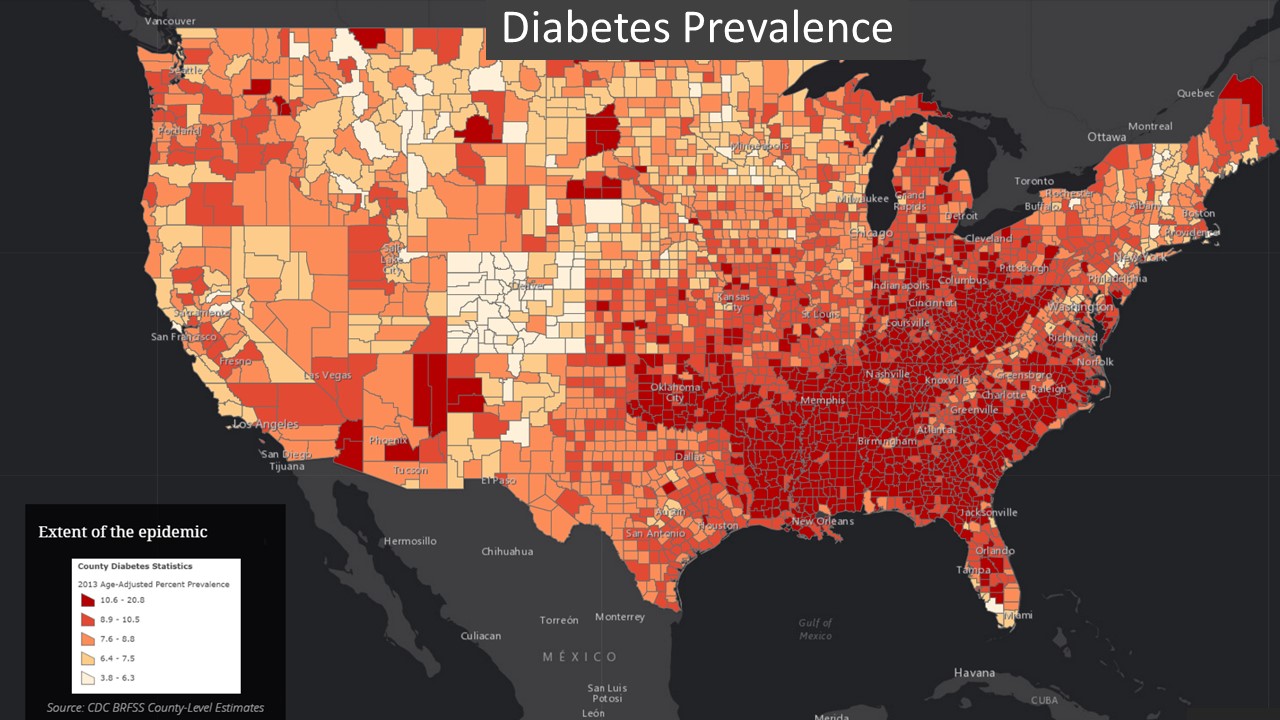
Prevalence of diagnosed diabetes by county in the US. 2013. (Data Source CDC)
What is a GIS?
Despite the ubiquitous nature of location in our data and our lives, it is a variable that we still under-utilize in health and health policy decisions. How then, do we put geography to use in health policy decisions? Nowadays technology provides the simplest answer – we use a geographic information system (GIS).
A GIS lets us visualize, question, analyse, and interpret data to understand relationships, patterns, and trends. It is a system like any other information system but with the addition of geographic references in the data. But that one simple addition packs a boat load of value.
Why use GIS?
A location perspective helps us to view easily and interpret vast amounts of data and forces us to think differently about what we’re seeing. Those insights improve decision-making, ensuring that we allocate the right resources to the right people in the right places. Employing GIS to target and tailor action plans increases efficiency, accuracy and productivity, reduce costs, and enhances communication, collaboration and information access.
A GIS can have a profound effect on the way an organization functions and the confidence with which it makes decisions. For example, the World Health Organization’s polio eradication programme used GIS tools to address the polio outbreak in Syria and Iraq in late 2013 and early 2014. Real-time data collection helped them to identify gaps of unvaccinated children and intervene to prevent the spread of this disabling and sometimes fatal disease.
A GIS an indispensable tool for evidence-based decisions. It also promotes policy initiatives in transparency and engagement. The Northern Kentucky Health Department in the US provides a great example. In an interactive story map, the department explains how it has educated the population about the severity of local opioid abuse usage and its sequelae, shared the resources available to the community, and showed how the department and other local organizations are responding to tackle the crisis. Over 15,000 people have engaged with the story map to date.
One type of policy decision that is impossible to make without the benefit of location intelligence is the fair distribution of resources. Without understanding geographic differences in social determinants of health and population needs, leaders may choose to equally distribute diabetes education centres in a community that only has pockets of uncontrolled diabetes, or place senior day care centres in a grid-like pattern despite certain areas having a predominantly younger demographic.
It is far more useful and cost effective to place resources in the areas where people need them (equitable not equal). More importantly, fair and equitable distribution of resources is a key factor in mitigating health inequities and improving population health outcomes. Using geography to make these kinds of policy decisions is both ethical and economical.
Location is foundational
The first step in using geography to drive insight and policy decisions lies in answering the simple question What is where? In our daily lives, it’s perfectly natural to query where things are located in the world. We tend to ask this question in two ways.
What is at? Such questions are common to getting to know a place. For example, when we move to a new town, we may wish to know what kinds of local resources and community assets exist in the town. What does the built or natural environment look like in the new neighbourhood? Is the landscape mature? Are there pavements for pedestrians to keep safe from traffic?
Where is it? In this case, the question originates from a desire to locate a certain type of feature, like a school or a market. Placing things in geographic space brings them into immediate perspective.
In health geographics, we operationalize What is where? by developing and maintaining foundational data resources. These are data resources that become reference materials for analysis or information products. For example, health organizations may collect and update data on infrastructure assets such as: hospital facilities, programme locations, pharmacies, or substance use treatment centres. This is a valuable first step in geo-enabling a health information system.
Thematic data can also be foundational. That content will depend upon the organizational mission. For example, a national government initiative on reducing the burden of diabetes may use diabetes prevalence data to map where diabetes exists across the country and visually compare the variation from one place to another, discerning broad patterns in the data. Comparative views can highlight stark differences in health status. For example highlighting the low prevalence of diabetes in Colorado against the very high prevalence in the South-eastern part of the US.
We can glean different kinds of information when data contain a temporal component in addition to the spatial variation. In other words, we can answer the question:
Where are things changing? Understanding spatio-temporal patterns in data has significant policy implications. We can use such data in looking forward in time to see if certain patterns are predicting a future problem that may require a larger up-front resource allocation to avoid downstream consequences. On the other hand, examining the historical spatio-temporal variation in a dataset may tell a story about the success or failure of an intervention.
Spatial statistics
What is where?
As in traditional statistics, there are some basic spatial statistics that help us to dig just a little deeper into the What is where? question. While we observe minima, maxima, means and standard deviations in traditional datasets, in GIS we focus on measuring size, shapes and spatial distributions and directions in a geographic dataset. For example, we might observe racial segregation/de-segregation over time, the increase in urban sprawl, the spread of infectious disease or the path of a storm through populated areas.
Understanding how things are moving through space and time helps policymakers to anticipate impacts and prepare response activities.
The most effective GIS systems begin with What is where? Foundational data needs have been carefully anticipated, collected and kept updated so that they are ready when either a common or critical use arises. Foundational dataset examples for health include: facilities and capital assets, partner locations, demographic data with population characteristics and potential vulnerabilities and thematic information relevant to the organization’s mission.
A GIS system, fuelled with relevant foundational datasets, moves an organization one step closer to creating well-designed information products that help people make better decisions.
Why is it there?
Understanding What is where? grounds a decision-maker in the geographic distribution of a theme or concept of interest. That has great power since geographic visualization makes data more compelling, more readable and engages the viewer at a deeper level. A natural consequence of that engagement is that viewers will begin to recognize patterns in their data and ask questions about them. Are they real? What’s causing them? How do those causes or triggers vary over space and time? Ultimately, we need to employ analytics to address questions of why.
Geographic or spatial analysis is different from traditional analytic methods. The difference originates from a basic principle articulated by Waldo Tobler which states, ‘Everything is related to everything else, but near things are more related than distant things.’
Spatial autocorrelation
The weather offers a useful example of this idea. The temperature in adjacent towns is likely to be more similar than the weather in distant towns. This idea of relatedness, also known as spatial autocorrelation, is the first law of geography. It is exactly what makes geography worth studying.
As a measure, spatial autocorrelation tells us the level of importance of geographic characteristics in affecting a given object, person or population. Spatial autocorrelation helps us to understand pockets of disparity, varying access to care and clusters of cancer to name a few.
Given the value of spatial autocorrelation in health geographics, it is important to properly account for it in any geographic analysis. At the highest level, we must recognize the implications of relatedness in statistical procedures.
Statistical power
A primary consideration is the impact of relatedness on the statistical power of a study. This is key since we require adequate statistical power to ensure that study data can support, with high probability, the appropriate rejection of the null hypothesis when a specific alternative hypothesis is true.
In traditional statistics, ensuring power is usually straightforward. Studies are strategically designed so that observations are independent before undergoing testing. However, geographic observations, by their nature, and by Tobler’s first law of geography, are related. This means that each observation is not independent and in fact, contributes to power less.
More data are always needed to achieve adequate statistical power in a geographic study. This may be inconsequential when the study uses datasets with a plethora of observations, like hourly pollution monitoring from multiple sensors over an area. But the impact could be devastating when studying a rare health condition in a rural area.
Testing for autocorrelation
A second important component of spatial analysis that differs from traditional methods is the actual testing of the level of spatial autocorrelation. There are several potential measures from Geary’s C and Moran’s I to the Mantel Test. No matter the test, the idea is to determine the intensity of spatial relatedness in a dataset. High levels of relatedness are called clustering, like when we find evidence of cancer cases proximate to a toxic waste site. Low levels of relatedness can be seen in completely uniform datasets, like arranging pharmacies at the Northeast corner of every block in an area. Accounting for statistical power and the intensity of spatial relatedness lays the groundwork for asking Why is it there?
Analysing data to answer specific questions
Specific analytic methods for asking why can take many forms. It is best that policymakers begin with the question needing resolution before deciding on a method of analysis and let drive data collection and analytic methods. The following examples highlight how different geographic methods can be applied to get at key answers.
How are people and places related? Diving into this analysis provides specifics about what may be nearby or coincident, what is closest, what is visible from a given location, what overlapping relationships exist in space and time, and how many of a thing exist within an area. Practical examples of this kind of analysis include: correlations of increased lung or liver cancers in residents living near a sewage plant, gravity or choice models looking at the role of geography on patient access to treatment locations and the number of disabled people living within a flood zone. Getting clear on the relationships between people and places provides needed insight for mitigation strategies when health concerns arise.
What is the best location or the best way of getting somewhere. Finding a location or site selection is a common type of geographic analysis. Generally, a decision-maker has a set of criteria in mind befitting an ideal location. For example, a health system manager may decide to open a multi-specialty clinic and will look for a location that is: currently under-served, well populated, in need of specialty services, distant from major competitors, and low on neighbourhood crime. Each criterion in this example can be defined within a range and weighted in importance to determine a final list of compliant sites.
The analysis of paths or calculating the best way to get somewhere can range from very simple to very complex. We should not underestimate the value of getting a person from point A to point B. Perhaps that value is easier to grasp when we consider the consequence of not getting from point A to point B effectively.
Detecting and quantifying patterns
Detecting and quantifying patterns comprises the most common of the spatial analytic methods. Techniques in this category include hot spot analysis, cluster and outlier analysis, time trends and feature grouping to name a few.
It’s critical for decision-making to know if a visualized pattern in the data is real. Analytically, we do this by testing for statistical significance, assessing the biologic plausibility, and observing the effect size. When we confirm significant clusters we can allocate resources to places with the highest need.
Dr. Atul Gawande provided a great example in his 2011 article, The Hot Spotters, in which he related a story of hospital readmissions in Camden, New Jersey. Hospital readmissions are an expensive problem that also reflects unfavourably on quality of care. Dr. Gawande highlighted how hot spot analysis, performed on a hospital’s most expensive patients (those frequently readmitted to the hospital within 30 days of discharge), found that a large number of those patients lived in two of Camden’s low-income housing complexes.
Further analysis determined that the people in those buildings had difficulty accessing primary care services. These services would have helped them to manage their chronic diseases and avoid repeated hospitalizations. In the end, the hospital placed small primary care offices in the two buildings in question. This intervention both improved the continuity and quality of care while also cutting hospital readmissions costs by nearly fifty percent. Knowing the hot spots, determining the underlying causes, and smart resource allocation dramatically improved results.
Predicting the future
Decision-makers frequently want to know what’s coming next so they can prepare for it. The need for prediction spans all aspects of health. Health systems have a need to do capacity planning which involves predicting population needs in the geographies they serve. Public health officials need to predict the spread of infectious diseases, whether locally contained, like a food-borne illness, or global like Zika virus, dengue fever or malaria. Using geography to make predictions offers the potential to get ahead of health issues – a game changer for any decision-maker.
Presenting information
Although there are inherent difference between spatial analysis and traditional statistical analysis, some things remain the same. As we endeavour to understand why things happen, we must always exercise caution in how we present information.
It is incumbent upon the GIS analyst to ensure that they use proper cartographic and visualization methods to show results that fairly and correctly answer the question. At the same time, map readers should also develop savvy with a fundamental understanding of geographic data presentation. When these things are properly achieved, answering Why is it there? provides the critical link between raw data and decision-making.
Why do I care?
We might say that we answer the first two questions What is where? and Why is it there? to get to this last question Why do I care? This is the part of the workflow where all the action takes place, where policy decisions are made, where resources are allocated, and where interventions are targeted and tailored for greatest impact.
We care because, as leaders, it is our responsibility to render the best possible decisions to improve health. Those decisions must be driven by timely and accurate data, sound analytic techniques, and the unique insight offered by geography to address some of the greatest health challenges of our day. The social determinants of health, the opioid crisis, tobacco use and universal health coverage all serve as compelling use cases for a geographically based approach. GIS can have a profound effect on the way an organization functions and the confidence with which it makes decisions.
Not only is a GIS an indispensable tool for evidence-based decisions. It also promotes policy initiatives in transparency and engagement.
The Northern Kentucky Health Department provides a great example. In an interactive story map, the department explains how it has educated the population about the severity of local opioid abuse usage and its sequelae, shared the resources available to the community, and showed how the department and other local organizations are responding to tackle the crisis. Over 15,000 people have engaged with the story map to date.
Implementing GIS
GIS offers powerful value with a rich infrastructure and sophisticated analytic capabilities. These are integrated in a platform that supports numerous tools and apps to get work done. The question remaining now is how to realize this value in your organization.
It is best to begin by developing a location strategy. This means that people within the organization have taken the time to assess whether the geographic perspective will add value to their mission. They must envision the specific value-based outcomes they plan to achieve. The expected value of the system should be greater than the cost of purchasing and implementing the system.
Choosing the software
The first consideration for most organizations will be the price tag associated with purchasing software. There are many choices available to fit the needs of any health unit. The range of costs, however, is broad (from open source to vendor-based solutions), making choices more complicated. For that reason, multiple factors will enter in to a buying decision.
- What features and functions are essential to address the organizational need?
- How many people will use the system initially and what are their training needs?
- Will the system scale and expand as the business needs grow?
- Are developers required to write applications and ensure interoperability or is the system configurable and ready to go?
- Will this be a desktop solution or an enterprise solution? Does the organization want to manage the infrastructure (i.e. servers) or work in a cloud-based environment?
- Are prospective users of the system dealing with protected health information? How quickly can the system be implemented and used to create value?
- What kind of support needs are anticipated as the organization adjusts their workflows to leverage geography?
Each of these questions will reframe the idea of ‘cost’ in a way that helps you make the best choice for your unique situation.
Other resources required
Once the location strategy has begun and initial outcomes are defined, then an organization should consider the other resources they’ll need. The biggest investment in resources is generally in the human capital. Human resources are required to run the system, collect and organize data, run analytics, and evaluate progress. Investments should be made in proper training. Change management is important to ensure that organization’s success in implementing its new GIS program.
It’s also worth remembering that training is not always the same for every user. Depending on the role of the GIS user, they may need relatively simple skill development, like when using mobile survey tools. The GIS analyst, performing statistical procedures on data, will need longer and deeper training.
Technology needs and deployment methods
Whatever GIS technology they use, purchasers should look for extensibility and scalability. Theu should also look for whichever features and functions they require for their planned activities. Nowadays, interoperability is critical to technological efficiency. It should be a requirement imposed on any GIS software vendor before signing on the dotted line. Organizations should not have to write programmes to connect one technology to another.
There are several deployment options for a GIS platform system. A simple yet powerful approach is to use an online GIS, engaging in a software as a service (SaaS) model. In this model, the organization does not need to host the infrastructure to support an enterprise system. It can extract all of the value through the cloud. Some health-related organizations, however, may be unable to use or opposed to cloud-based models. One reason may be the need to pay for annual licensing of the services. Users should balanced this against the costs of internal infrastructure over time.
In most instances, however, the opposition to a cloud-based system relate to concerns about unintentional breaches of protected health information. Those organizations may prefer an enterprise deployment, on premises, and within firewalls. Between these two options is a hybrid approach that leverages the advantages of each method. An organization should consider which approach offers it the flexibility and security needed for its proposed usage.
Governance
Any organization that chooses to take advantage of the benefits of GIS for advancing its health agenda should also take the time to develop and systematize governance procedures. This effort will help to align staff on the policies surrounding the use of geographic data and keep the system humming.
Contents
Source chapter
The complete chapter on which we based this page:

Geraghty E. (2019) Advancing Health Policy Using a Geographic Approach. In: Macfarlane S., AbouZahr C. (eds) The Palgrave Handbook of Global Health Data Methods for Policy and Practice. Palgrave Macmillan, London.
Additional resources
Spatial Statistics, Spatial and Spatio-temporal Epidemiology is a peer-reviewed scientific journal that provides a home for high quality work which straddles the areas of GIS, epidemiology, exposure science, and spatial statistics.
International Journal of Health Geographics is an interdisciplinary, open access journal publishing internationally significant studies of geospatial information systems and science applications in health and healthcare.
Health and Place is an interdisciplinary journal dedicated to the study of all aspects of health and health care in which place or location matters.
esri Spatial statistics resources provides several spatial statistics resources such as videos, slideshows, documentation and hands-on tutorials.
World Health Organization. Introduction to the HealthMapper: a World Health Organization information and mapping application for public health
Latest publications ⇒