

Image by geralt from Pixabay
What is demography?
Whether on a global scale or for a small geographic area, the demographer’s task is to answer questions about: the number of people in a population at a point in time,;where they reside; how they distribute at least by age and sex; how these numbers have changed; and how they will shift over years.
Demographers estimate and explain these population dynamics for a given geographic area by describing changing patterns of fertility, mortality and migration.
The equation below is central to the demographer’s quest to answer these questions.
The change in population size in a geographic area over a time-period EQUALS the natural increase (number of births (fertility) minus number of deaths (mortality)) over the time-period PLUS net migration (number migrating minus number emigrating) over the same time-period.
Demography also seeks to answer questions about the physical and social contexts in which people live. It overlaps with disciplines such as epidemiology, sociology, anthropology, geography, economics, biology, and public health.
Demographic enquiry may focus narrowly on key demographic variables of fertility, mortality and migration. It may also focus on relationships between demographic variables and social, economic and health phenomena. Demographers inform communities, governments, researchers and international agencies in planning the scale of population interventions.
Why demography?
Demographers also predict the impact on population movements resulting from climate change, extreme refugee movements and changes in composition such as increased aging. Analyses of population growth and structures, as well as the spatial distribution of populations, inform governments. For example, to plan transportation systems and locate facilities such as schools and hospitals. Estimations of mortality rates and how long people will be expected to live after attaining a certain age inform insurance industries to determine premiums for various categories of people.
Demographers thus collect and analyse data to describe the size, structure, distribution and growth of populations. We review their primary data sources.
Sources of demographic data
Traditionally, demographers collect data using one or more of three complementary sources: – population censuses, civil registration and vital statistics systems (CRVS) and household surveys. These are explained elsewhere on the website. Longitudinal surveillance systems collect data in settings where vital registration systems are not functional. Types of longitudinal systems include:
Population registers
Some high-income countries, such as Austria, Sweden, Denmark, Finland, Norway, The Netherlands, Japan, and Israel, maintain registers of their current living populations. These registers extend beyond individual registration of events through CRVS, to link records across events for an individual, including civil status, place of residence and migration events.
For instance, when individuals die, the system records their deaths and removes them from the population currently alive. When individuals marry or divorce, or migrate in and out of the country, the system links these events to their records and updates the database using unique personal identifiers.
A population register generates counts of events occurring in the population (the numerator) as well as the total population (the denominator) at a specific time. This means that demographers can compute rates without having to combine data from several sources. These registers require sophisticated data linkage software and depend on a functioning CRVS system.
Sample registration systems and verbal autopsy
Some low- and middle-income countries, where CRVS coverage is low, use sample registration to produce national demographic indicators.
A sample registration systems (SRS) is similar to full vital registration except that takes place in a nationally representative sample of small areas, such as villages or sections of urban areas. Another difference is that the CRVS system is essentially passive, relying on families to notify births and deaths to the registration authorities. By contrast, SRS systems actively seek out vital events.
Resident enumerators in the sampled areas start by undertaking a baseline survey and then continuously record births and deaths in the population to generate annual fertility and mortality statistics. Regular retrospective surveys in the same vicinities as the SRS validate data and produce additional information.
India initiated a pilot SRS in 1964-65, scaling it up to a full blown system 1969-70, and has since continued to operate, generating fertility and mortality rates, as well as cause-specific mortality, on a regular basis.
Verbal autopsy
SRS can use verbal autopsies to ascertain probable cause when deaths occur at home without medical certification using verbal autopsy techniques.
Trained enumerators interview caregivers of relatives who have died, to ascertain the probable cause(s). They use a structured questionnaire that elicits information about the circumstances or events leading up to the death including illness history. To ensure reasonable certainty, a minimum of three physicians independently evaluates the verbal autopsy interview to decide the probable cause of death. If there is agreement by at least two physicians, that cause is designated; if there is disagreement even after evaluation by other physicians, cause of death is declared indeterminate.
Researchers have used verbal autopsy extensively for determining cause of death. This experience has led to: 1) cost- and time-effective improvements in verbal autopsy questionnaire design,; 2) use of mobile devices; and 3) use of computer algorithms for determining and coding the probable cause of death. These developments offer effective alternatives to physician certification of cause of deaths. This is iinvaluable in situations where most deaths occurs outside the hospital.
Health and Demographic Surveillance Systems
The Health and Demographic Surveillance System (HDSS) is a non-traditional source of population and health data. Scientists use HDSSs to obtain longitudinal data on small populations of individuals in low- and middle-income countries. These systems maintain a population register for all individuals living in a defined area. They do this by continually and actively observing all demographic dynamics, including: births; deaths; and migrations in-and-out of the area.
The South African Ministry of Health set up the earliest of these longitudinal community-oriented programmes in rural Natal in 1940 and researchers have subsequently set up many more. Since 1998, the International Network for the Demographic Evaluation of Populations and Their Health (INDEPTH) Network has coordinated HDSS sites. INDEPTH provides a platform to share information, data, and standardised methods of analysis and disseminate findings. As of 2017, INDEPTH coordinated research from more than 50 HDSS centres in about 20 countries in Africa, Asia and Oceania.
A HDSS starts with enumerators undertaking a baseline census, allocating unique identifiers to households and individuals in the population. Enumerators visit each household at defined intervals to record changes that occur through births, deaths or in-and-out migrations, as depicted in the figure below. HDSSs may also include registration of marriages, divorces and changes in household status relationships.
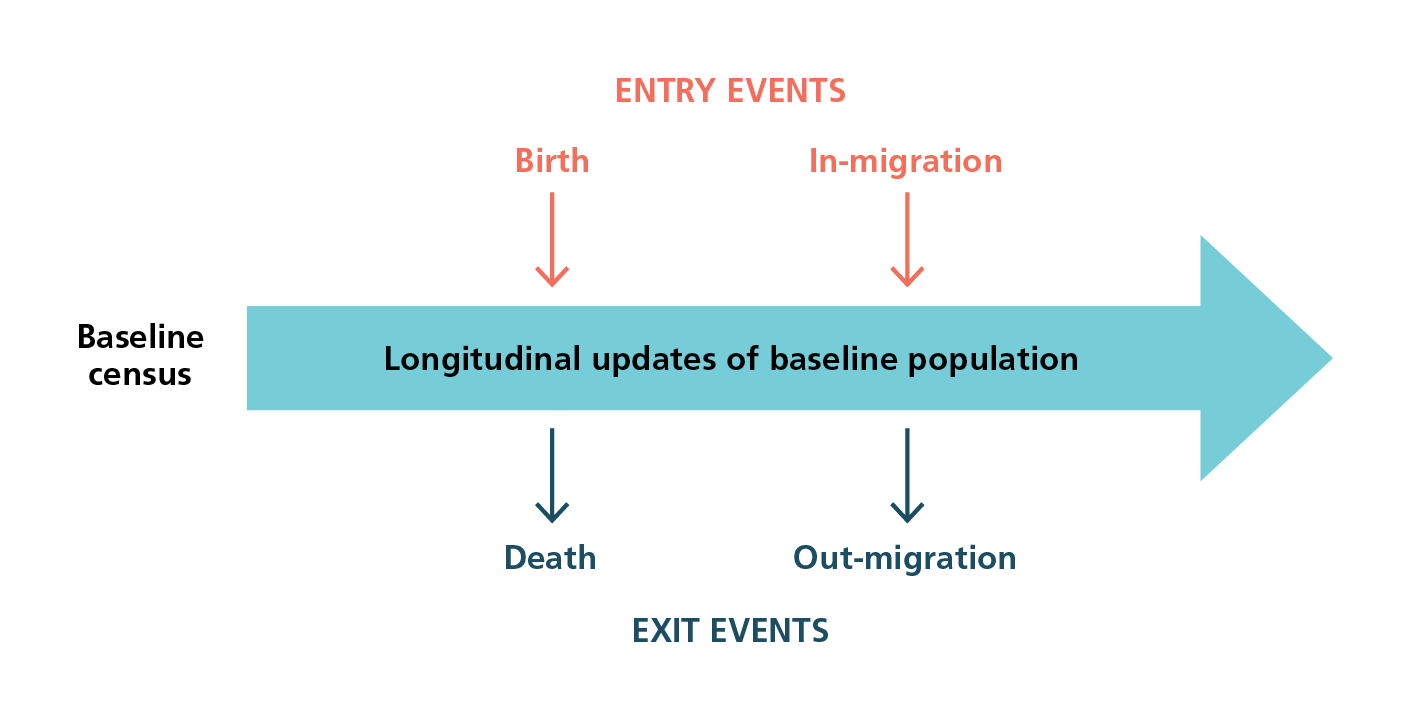
How a Health and Demographic Surveillance Site operates
Because everyone in the database has a unique identifier that links events to individuals within households, the HDSS centre can record all status changes occurring to all individuals within households. Record linkages make it possible to examine risks attributable to changes in individual status, for example death. Individuals surviving at a point in time are easily defined. Registration of migrations in and out of the area permit precise individual level definition of censoring or loss to follow-up. Using verbal autopsies, HDSSs can collect cause of death data at the population level.
DHSSs provide invaluable information but have some limitations. One is that the study sites are their own population and not representative of a general population. Researchers choose sites because they want to study the demographic and epidemiological dynamics of a specific population. Or they need a population laboratory to evaluate interventions and undertake a range of studies. Another limitation of the HDSS is the cost of maintaining consistent data collection over a sustained period. Fortunately, data management systems have become streamlined over the years taking some burden off enumerators. Regularity of follow-up can lead to respondent fatigue and raise ethical questions around respondents’ choices about participating for the long-term.
Demographic analysis
Demographers summarize data as indicators of:
- Fertility such as the crude birth rate, age-specific fertility rate, and total fertility rate;
- Mortality such as the crude death rate, neonatal, infant, under-five mortality, and adult age-specific mortality rates, and the maternal mortality ratio;
- Migration, that is immigration and emigration rates; and net migration
- Population change such as population growth and population density.
Demographers provide population pyramids for age and sex categories, tables showing life expectancy by age, and publish population projections. They apply statistical and mathematical methods to estimate these measures. We provide an overview of some of these methods.
Assessing data quality
In addition to routine quality control on data collection and entry, demographers apply internal and external consistency checks to ensure quality.
Respondents who do not know their ages may guess or round their ages to multiples of five years, for example. Demographers check quality of age reporting by looking for specific digit preferences and by assessing the distribution of age and age-sex ratios using Whipple’s and Myer’s indices.
Demographers also assess sex and age distributions by studying consistency between population pyramids obtained from different sources, for example between two censuses, and by comparing the distributions with external stable population models. They triangulate their analyses using multiple methods and apply complex approaches to re-analyse data, for example using reverse survival methods to estimate fertility.
Some of these methods are described in detail in Tools for Demographic Estimation.
Direct and indirect estimation techniques
When CVRSs are fully functional and complete, or when there are adequate survey or census data, demographers estimate most population indices directly from the data. For example, they calculate the infant mortality rate for a specific year by dividing the number of known infant deaths (from CRVS) by the number of infants in the population at the mid-point of the year (from the census).
Where CRVS data are lacking or incomplete, demographers use indirect methods to estimate rates from survey and census data.
Estimating fertility and childhood mortality
To estimate fertility and childhood mortality rates indirectly demographers ask women in surveys and censuses (between the ages of 15-49 years):
Separately for boys and girls:
- The number of children to whom they have ever given birth;
- How many of those children are still surviving;
- How many are dead, separately.
To ensure that they don’t miss any children, enumerators ask women whether the children are currently living with them or living elsewhere.
Researchers then tabulate these data as proportions alive or dead, and probabilities of dying calculated by age or duration of marriage.
Estimating maternal mortality
Although indirect methods initially focused on child mortality and fertility, they were subsequently extended to estimate adult mortality, particularly maternal mortality using sibling or birth histories. Developments of these methods allow for directly estimating maternal mortality. The direct method asks respondents to provide more detailed information about their sisters, numbers reaching adulthood, number who have died, their age at death, years in which the death occurred and years since the death. Demographic and Health Surveys now regularly collect this information to estimate maternal mortality directly.
Assessment of indirect methods
Indirect methods are complex and have some limitations.
- First, most of these methods assumed that both fertility and mortality were high and unchanging. These assumptions are no longer valid because there have been dramatic declines in both fertility and mortality even in sub-Saharan Africa where fertility and mortality remained high for a long time.
- Many indirect methods also assume independence between the deaths of children and their parents, an assumption that is not true.
- These methods are also fraught with recall biases because interviewers ask respondents to report events that occurred to themselves or their relatives many years ago; casting doubt on the completeness of data.
Demographic and Health Surveys
Demographic and Health Surveys (DHS) capture the indirect fertility and childhood mortality questions in the summary birth history section of the survey instrument labelled as reproductive history.
DHS has introduced refinements to the method by collecting data beyond the above indirect questions to estimate fertility and mortality directly. In the DHS birth history module, the interviewer asks the woman to list each of her births. For every child to whom the woman gave birth, the interviewer asks about its sex, age, whether the child is still alive or dead, current age if alive, and if dead, how old it was at death. With this information for each child, demographers can estimate fertility and childhood mortality directly with very limited biases.
The challenge of this module is that because the questions are only asked during sample surveys, the findings are subject to sampling errors.
Life tables
A life table describes a cohort of individuals born to a specific population in a particular year going through life and diminished by death. The life table produces one of the most important summary measures of a population’s health known as life expectancy, which shows the average expected duration of life in a population from a specific age. Its figures are based on mortality rates estimated for different age categories preferably using long-established CRVS data.
- National statistical offices in countries with CRVS, such as in the United Kingdom, Australia, Canada, and the US, regularly publish life tables even for sub-populations. The US Centers for Disease Control and the Social Security Administration, for example, produce annual life tables for purposes of social security administration and to monitor progress in population health.
- Countries that do not have adequate CRVS data to produce their life tables, use model life tables published by the UN Population Division.
- The World Health Organization (WHO) publishes life tables through its Global Health Observatory database, as does the Institute of Health Metrics and Evaluation (IHME) through its Global Burden of Diseases Studies.
- In 2004, the INDEPTH Network published the first ever life tables for sub-Saharan Africa based exclusively on empirical data from 18 demographic surveillance data in sub-Saharan Africa. Before this publication, life tables for sub-Saharan Africa had used model-based data.
The life table is so versatile that its application goes well beyond mortality analysis. For instance, it can be used for nuptiality analyses such marriage transitions (marriage, divorce, remarriages), contraceptive use and discontinuation rates, and fertility analysis using parity progression analysis, among many others.
Population Projections
Population projections model the size and composition of a population through time, such as world population growth. The UN defines population projections as ‘calculations which show future development of a population when certain assumptions are made about the future course of fertility, mortality, and migration. They are in general purely formal calculations, developing the implications of the assumptions that are made….’ Projections are predicated on the theory of population change; that change or growth is inevitable and depends primarily on fertility, mortality and migration.
Projection methodologies can be very simple, based on a few assumptions about the future, or very complex. Simple projections assume linear or exponential population growth. Component type projections, on the other hand, make detailed assumptions about fertility, mortality and migrations with anticipated trajectories of change within population subgroups, and have more complex data requirements and input parameters. Choice of projection method is a trade-off between level of accuracy required, availability of data, and composition of the final product.
Several organisations regularly conduct projections, including the UN Population Division, the WHO, the International Institute for Applied Systems Analysis in Austria, the IHME, the Population Reference Bureau in Washington DC, census organisations in countries and academic institutions such as universities.
The UN Population Division regularly produces population projections for most regions and all countries of the world. They present the results of these projections in Excel files displaying key demographic indicators for different subgroups groups for major areas, region and countries, spanning the period 1950 to 2100.
Data repositories
Many institutions collect and publish demographic data.
WHO also collates and reports on health statistics for its 194 member countries through its data observatory. Other international institutions that support production and archiving of data include the African Development Bank, Asian Development Bank and the African Union through its data commission. In addition:
- The Institute of Health Metrics and Evaluation (IHME) produces demographic estimates, health statistics and impact evaluations.
- The Washington, DC, Population Reference Bureau publishes an annual World Population Data Sheet, with data from 200 countries regarding important demographic and health issues, including population estimates, fertility rates, infant mortality rates, HIV/AIDS prevalence, and contraceptive use, among many others.
- Other universities and institutes of higher learning and research constitute some of the big users of demographic data collected around the world. Many of these institutions archive data primarily for analysis. Examples of data archives around the world by universities and research institutions include the University of Michigan Inter-university Consortium for Political and Social Research (ICPSR) in the US
- Princeton University’s Office of Population Research large data archive on legal migrants to the United States; University of Minnesota Integrated Public Use Microdata on census data around the world;
- United Kingdom’s University of Essex data archive; and the Australian data archive at the Australian National University
- In Africa, some of the data archives by universities and research institutions include: the South Africa Data Archive; University of Cape Town’s data archive, DataFirst, and the University of Cape Coast data archive in Ghana
- The INDEPTH Network maintains a repository of longitudinal population and health data that its member institutions have collected in low- and middle-income countries.
Challenges and innovation
A significant challenge facing the field is dwindling funding to build demographic capacity. Donors who supported training and research opportunities in demography from the 1960s through to the 1990s have cut-back their support. This has led to closures of many demographic training institutes in low- and middle-income countries. Countries still need demographers to run censuses, develop CRVS, and make demographic estimations. Related to funding are dwindling numbers of technical demographers.
In spite of advances in data collection, progress has been relatively slow regarding coverage especially for CRVS in low- and middle-income countries. There have been tremendous improvements in survey and census data collection. But quality of data remains a problem in many parts of the world. The challenge remains for countries to analyse and utilise their data properly for national development.
Data warehousing and gatekeeping is another challenge. Despite remarkable improvements in data collection, many countries impose such strict access rules on use of data that they cannot realise the full potential of the data.
There have been some innovations. Smartphones with Geographic Positioning Systems (GPS), have revolutionised data collection. Use of GPS improves accuracy, timeliness of data capture and processing, as well as the granularity of information captured. When households are geo-referenced, demographers use geographic information systems and statistical analyses to study the spatial distribution of demographic phenomena. This branch of demography is known as spatial demography.
Contents
- What is demography?
- Why demography?
- Sources of demographic data
- Demographic analysis
- Data repositories<
- Challenges and innovation
Source chapter
The complete chapter on which we based this page:

Bawah A.A., Binka F.N. (2019) Describing Dynamic Populations: Demographic Data Methods. In: Macfarlane S., AbouZahr C. (eds) The Palgrave Handbook of Global Health Data Methods for Policy and Practice. Palgrave Macmillan, London.
Additional resources
United Nations Department of Economic and Social Affairs, Statistics Division. Demographic and social statistics
Moultrie et al. Tools for demographic estimation.
United Nations. Manual X:Indirect Techniques for Demographic Estimation.
Lundquist et al. Demography: the study of human population.
World Health Organization. Verbal autopsy standards: ascertaining and attributing causes of death
United Nations. World population prospects 2017
Latest publications ⇒
- Demographic and health surveillance systems ⇒.
- Population register ⇒
- Verbal autopsy ⇒
- Population projections ⇒
- Indirect methods of estimating mortality ⇒
- Life tables ⇒