

Image by Pete Linforth from Pixabay
How can we trust the data?
Users of data, and of information based on the data – whatever its source – need to distinguish data that are reliable and trustworthy from those that are inaccurate or misleading. This is possible when data producers follow agreed principles and procedures for collecting and analysing data and when they disseminate data and information clearly and transparently.
Epidemiologists assess survey quality by examining sampling and non-sampling error. For example, the concept of Total Survey Error (TSE) provides a framework for describing errors that can occur during the design and conduct of a survey. Holders of official data and statistics use similar approaches to assess data quality and information across several types of data source, including surveys, but add dimensions that address their fitness for use.
We describe a common approach to assessing data and information quality across three critical data sources for health. These are censuses, registries (with civil registration as our example) and population surveys. The approach applies to most data sources.
Purpose of data collection
The purpose of data collection is to describe target characteristics of a target population consisting of population units.
- A census aims to count an entire country’s population and describe its socio-demographic characteristics at a point in time.
- Civil registration intends to count all births and deaths in a defined geographic area as they occur and describe causes of death.
- A household survey might, for example, aim to describe the demographic structure and the prevalence of health conditions among adults in a country.
Having established clear objectives, the programme team focusses on planning, collecting, and processing data, and disseminating information based on the data. This process is never perfect. The team monitors and documents the process. Their goal is to understand the extent to which the resulting observations represent the intended target characteristics of the intended target population.
The dataset
Transforming data into information
The dataset is central to transforming data into information.
- During planning, the programme team aims to ensure that the dataset is adequate to provide the intended information.
- During data collection, the team aims to obtain data for the dataset as planned.
- During data management, the team aims to clean and organize the dataset so that it can be analysed
- While analysing the dataset, the team aims to provide the required information.
- When disseminating information based on the data the team must defend the trustworthiness of the dataset
Matrix of data
In its simplest form, a dataset consists of a matrix of rows and columns:
- Each row (or record) represents an observed population unit, for example a newborn infant, a death or a household.
- Each column represents an observed characteristic, for example birthweight, cause of death or type of dwelling.
- Each cell represents the value of an observed (or edited) characteristic for an observed unit
| Representation of total error (Adapted from Biemer) | ||||||
Records of units in the dataset |
Measurements of characteristics |
Rows: Do the units represent the target population? |
||||
Column errors: Have the measurements been specified correctly? |
||||||
1 |
2 |
…. |
Row errors: are there any missing, duplicated or redundant records? |
|||
1 |
||||||
2 |
||||||
…. |
||||||
Columns and cells: Do the observed values represent the target characteristics? |
Cells errors: Are there any errors in cell values or any missing values? |
Overall: How well does the dataset represent the target characteristics of the target population? |
||||
Questions about the dataset
Users of the dataset need to ask:
- Do the records in the rows represent the units in the target population? That is, are there any missing, duplicated or redundant units that could bias the results?
- Have the measurements in each column been specified correctly? That is has the team used the correct instruments to measure or specify the characteristics it intends to measure?
- Are the cell values are correct? That is have the enumerators measured and edited them correctly and are there any missing values that could bias the results?
Life cycle of data quality
We follow Groves’ survey lifecycle approach to quality adapted by Zhang to include registries.
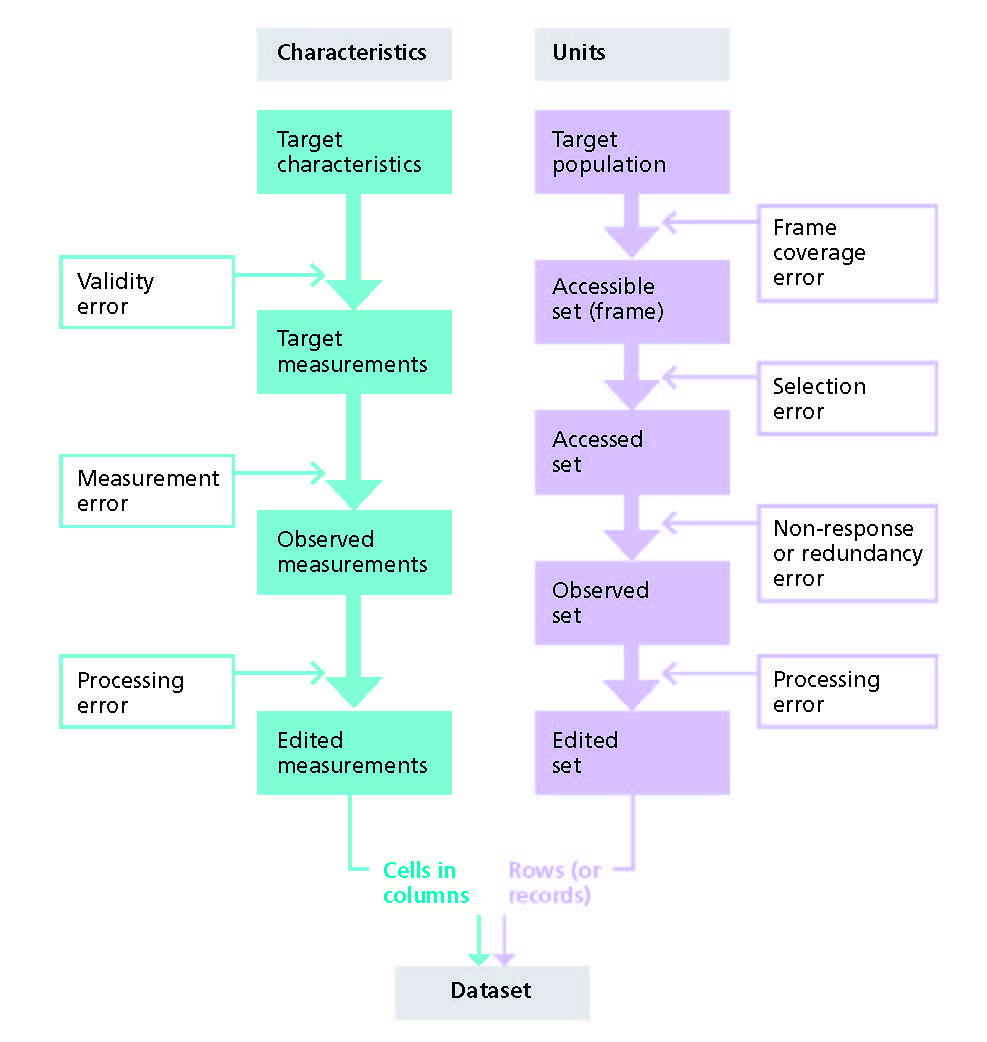
Life cycle of data from design to dataset from a quality perspective (adapted from Zhang and Groves)
Potential errors during the data life cycle
The extent of errors in the dataset depends on how well the programme team:
1) Planning for data collection
Protocols
Protocols or standard operating procedures (SOP) address why producers intend to collect data and the strategies they will employ to do so. They may describe, for example how a civil registration and vital statistics (CRVS) system will record data on vital events or how a survey will meet its objectives. All protocols/SOP detail the context of the work, who needs the data/information and why, and how the data will be collected, managed and processed to achieve the project or programme objectives.
Protocols/SOP also address ethical considerations and data security and include a budget and timeline. They describe roles and responsibilities and how the programme team will manage and supervise data collection and processing. We focus on how the protocol/SOP attempts to ensure the quality of the dataset.
The protocol/SOP describes procedures either to recruit all units in the target population (for censuses and civil registration) or to recruit a sample of units that represents the target population (for surveys). There are three steps in this process.
- The planning team attempts to establish a list or frame of all units in the target population, for example a list of households in a village, of census enumeration areas, or of hospitals reporting births and deaths to the CRVS system.
- The team accesses units from the frame, for example by selecting a sample for a survey, or using the complete list for censuses or registering all births and deaths reported by the hospitals.
- Enumerators attempt to observe the accessed units by interviewing and recording data about them.
Errors occurring during each of these steps affect how completely the rows in the resulting dataset (observed units) represent the target population.
Preventing frame coverage error
Investigators attempt to draw up a list of all units in the target population or to describe a process to identify them. We use the term frame to describe this list or process.
- Under-coverage occurs when the frame omits some units belonging to the target population or contain redundant units that do not belong to the population. Under-coverage in a survey occurs when an investigator prepares a frame of villages in an area but omits some that have not yet been mapped – thus excluding those villages from being sampled. Under-coverage occurs in a census frame if organizers omit dwellings or enumeration areas from the frame. Under-coverage of births and deaths is a major problem for CRVS in low- and middle-income countries. Registration systems may not be available to the whole population, for example ethnic minorities may be excluded from registration.
- Over-coverage occurs when enumerators duplicate some units belonging to the target population. Over-coverage in a survey occurs when the frame duplicates some villages giving them a higher chance of being selected. Over-coverage in censuses would occur if the frame included households more than once. In a CRVS over-coverage occurs if a death is reported more than once.
Thus the frame contains a list of accessible population units which are not necessarily the same as the units in the target population. The difference between the units in the list and the units in the target population results from coverage errors.
In developing the protocol/SOP, the planning team needs to assess the quality of alternative frames. In particular they need to consider the extent of coverage errors they might introduce. They should choose the frame that minimizes anticipated coverage error.
Since the census frame also serves as a frame for CRVS and sample surveys, it is essential that the census team maintains the frame between censuses. Once the team has selected a frame, it should document the possibility of different types of coverage errors and assess the likely impact of these errors on the team’s ability to describe the target population. If the team documents potential coverage errors, analysts can take them into account during data processing.
Preventing selection error
The programme team selects units from the frame for surveys and attempts to include all units for censuses and CRVS. Either way this process introduces selection or access errors.
- For surveys that use random sampling, investigators access or select a sample from a sampling frame. This introduces sampling error which analysts use during data analysis to estimate indicators based on the data. To be able to describe the sampling error, the protocol must specify a procedure that ensures that every unit in the population has a known probability of being selected. Investigators’ choice of sample size will affect the sampling error; the larger the sample size the small the sampling error.
Selection errors can also occur when accessing units for censuses and registries. Since these errors are not usually planned as they are for random sampling, they can bias the dataset.
- In a census, for example, enumerators may exclude a street or village mistakenly or intentionally, although the SOP usually elaborates procedures to prevent this happening. Alternatively, census forms may get lost in the mail and not reach the intended households.
- In CRVS, certain hospitals may not systematically notify the civil registration system of the occurrence of a vital event. Such errors are difficult to take into account in the analysis since they are not random. This is also true for surveys that do not use random sampling, for example when investigators select units conveniently, consecutively, or interview volunteers. Investigators drawing up a protocol/SOP should seek to minimize unintended selection errors or, if intended, describe how they could impact their conclusions.
Preventing non-response and redundancy error
Well-trained enumerators intend to observe all selected units but this is not always possible.
Unit non-response
Unit non-response occurs when selected units do not participate in the survey or census as planned, for example, survey enumerators are unable to interview heads of households, no one is present in the household, or the potential respondent declines to participate. Non-response is an increasing problem for household surveys. To reduce non-response, investigators should plan to visit households when participants are likely to be there and explain the purpose and benefits of the study very carefully.
Although in most settings householders are legally obliged to participate in censuses, they may omit people who should be included in the household on that day.
In countries where civil registration doesn’t function well, many people do not present themselves at the civil registry office to register births and deaths even though the system exists, in which case registration is described as incomplete.
Unit over-response
Unit over-response is also possible, but less common, for all these data sources. In a census, the same person may be listed in two dwellings, for example, a child whose parents live in different dwellings and both include the child on their respective forms. Births and deaths can be counted twice when a hospital and relatives report the same event. Relatives may report twice if they are unsure the event has been registered, forget they have already registered the event, or if they register at both place of occurrence and place of usual residence.
2) Collecting the data
The protocol/SOP describes the way in which an enumerator, registrar or respondent will make and record each observation or measurement aiming to ensure that all are valid, accurate and complete. The best way to avoid these errors is to adopt or modify standardized questionnaires and measurement tools that have been tried and tested. This will also help to ensure that measurements are comparable to those in other datasets collecting similar data.
Preventing validity error
The protocol/SOP itself controls the validity of each measurement.
The validity of the measurement is the extent to which the technique the enumerator will use to measure/observe a characteristic actually measures/observes what it is intended to measure/observe. In the figure, we describe this as the targeted concept.
Sometimes the programme team defines the concept in such a way that it does not actually represent the characteristic they intended to measure. For example, if the team wishes to measure height and weight but instructs enumerators to measure participants with their shoes on, they will not measure the actual height or weight of each individual. Similarly, if the programme team wants to measure age but does not specify that enumerators should collect information on exact date of birth, the resulting data will be a poor approximate for exact age.
Preventing measurement error
Measurement errors occur when enumerators do not take measurements as instructed or a when a respondent does not answer questions correctly.
Programmes can reduce measurement errors by only observing characteristics that are essential to their objectives thus keeping the questionnaire/interview short. Protocols/SOP should detail thorough training and guidance for enumerators and plan to pilot questionnaires and procedures to test instruments and resolve ambiguities in questions and definitions. Enumerators can reduce missing values by carefully explaining the purpose of data collection to potential respondents.
If enumerators or registrars record information within a short period of the occurrence of an event or activity this reduces problems of data recall errors and can increase the accuracy of the data collected.
- Household surveys, for example, ask about recent health-related events or health-related behaviour. The time frame will depend on the nature of the event/behaviour. But it may extend from the previous month (tobacco use) to the previous three years (use of antenatal care).
- CRVS systems have a legal basis that makes registration compulsory for all people living in a defined area and aim to register births and deaths as they occur, usually within a maximum of 30 days, to maximise accuracy and minimise missing information items. If relatives report an event late, they may not give the correct date of occurrence. For example when they need a birth certificate for their child to enter secondary school,
Inaccuracies can also stem from failure to apply uniform standards when recording information, Even though, in principle, trained physicians attending hospital deaths determine cause of death using international standards, cause-of-death data are often problematic due to excessive use of so called garbage codes, that is ill-defined or vague and unspecific causes of death. WHO estimates that the percentage of garbage codes is below 10per cent where CRVS functions well and deaths are routinely medically certified by trained physicians. But over 30per cent in settings where CRVS functions less well physicians are not so well trained in how to complete the medical certificate of death, such as in Azerbaijan, Bahrain, Egypt, Georgia, Oman, Saudi Arabia, Sri Lanka, and Thailand.
3) Processing the data
Whether data managers continually update data for civil registration or they collect data for a one-off study, they must check for deviations from the protocol/SOP and search for errors that occur during data collection.
When enumerators record data manually on questionnaires, their supervisors may check for specific types of error, and data managers look for further errors as and after they transcribe the data into a database. When enumerators collect data on electronic devices such as smartphones or tablets for direct transmission to the database, integrated software can recognize and query errors at the moment of data capture.
After data capture, data managers use standardised procedures to clean the dataset, that is to detect and correct or remove incomplete or inaccurate records. They aim to ensure the dataset is consistent with other similar datasets and conforms with data quality standards. They screen the dataset searching for oddities such as data gaps or duplications, outliers, inconsistencies, and unexpected patterns and results. They may simply clean the data by removing typographical errors or they may standardize or impute values for erroneous observations.
Most database and statistical software – for example Epi InfoTM – incorporate (sometimes dual) data capture and data cleaning tools. The data processing itself introduces errors which should be monitored and flagged when checking and cleaning the data.
Checking and cleaning data records
The magnitude and distribution of response errors across population sub-groups indicate the overall quality of the dataset.
Examination of duplicated records against eligibility criteria will identify units that were wrongly included in the dataset. In routine, ongoing data collection systems, duplicate records may occur due to the use of different spellings of names, unclear addresses, and absence of clear and unambiguous identifying characteristics. The use of a unique identification number in every registration record and associated certificate can help avoid this.
Missing records can be identified from the complete list of selected units that the team intended to observe.
Redundant records (carefully checked) can be removed from the dataset, but missing records can introduce bias.
Checking and cleaning data items
Ideally, the protocol/SOP, associated training and supervision of data enumerators, and automatic data capture procedures will keep data errors to a minimum. In practice, errors always occur and are often not apparent until the dataset is examined.
Typical measurement errors include values that:
- Are wrong, impossible or missing, for example, incorrect dates or implausible coding
- Fall outside the range that is possible for the measurement, for example, a hemoglobin count of 2 grams per deciliter or an adult height of 0.5 meters
- Are inconsistent with other data items, for example a child whose weight is impossibly low for its height, or a child of five years attending secondary school
- Measurements that are inconsistent between enumerators, coders or over time, that is they consistently take the measurements or ask the questions differently from each other
Age heaping commonly occurs in situations where respondents don’t have birth certificates or when enumerators accept rounded ages instead of obtaining dates of birth. Heaping can occur for any measurement, for example, if weight recorded in kilograms to only one decimal point shows last digit preferences for zero and five, this would indicate that enumerators have measured weights poorly. It is easy to identify heaping by looking at the distribution of the last digit. There should be an even distribution of digits. It is best to look for heaping during a pilot and rectify the problem by giving enumerators further training or by using a different method of measurement. Demographers use Whipple’s index to measure age heaping.
Preventing processing error
Data managers must follow rules in dealing with missing values; and if they have corrected or imputed any values, they need to document what they have done. They have to decide what to do with problematic data.
The options are to delete the data points, to correct them, or to leave them unchanged. When a data point is biologically impossible – for example, a maternal death in a male – it should either be corrected or deleted. It is sometimes possible to recalculate data that have been poorly coded, for example redistributing cause of death data that have been assigned to garbage codes. Van den Broeck et al. provide advice about data cleaning, presenting it as a ‘three-stage process, involving repeated cycles of screening, diagnosing, and editing of suspected data abnormalities.’
Assessing the dataset for analysis
Once the dataset has been cleaned, the data are available to produce basic tabulations and indicators.
This is another opportunity to check information quality, for example by checking the consistency of indicators with similar indicators based on datasets from previous years or based on other datasets.
Analysts can assess the possible impact on the findings of errors anticipated from the frame or discovered during data checking. They can make adjustments to estimates, if that is possible. This is time to return to the original question: how well does the dataset represent the target characteristics of the target population?
To check for bias caused by non-responders, analysts can compare any of their known characteristics with those of responders. This is difficult since non-responders by definition don’t answer questions. But it may be possible to compare publicly known demographic characteristics of the person, type of household, or geographic area (obtained perhaps through the sampling frame). The non-responder or a relative may have given a reason for their absence or refusal.
Documentation of the dataset must include a full description of response rates by important sub-groups. For example: persons living in remote areas, persons without a fixed address, minorities, ethnic groups etc. Special studies may be necessary to assess the extent to which such groups are excluded from the census or CRVS systems, whether for de jure or de facto reasons.
Item non-response can introduce bias for missing measurements. It is easier to assess the bias their absence might have introduced by comparing key information from their records with information from the records with a recorded value, for example, whether age was missing more often for units in rural than in urban areas.
When data collection includes all population units – as intended for censuses and CRVS systems – the indicators calculated from the data will be the true population values at that time. If there are gross measurement and coverage errors, the indicators could represent another population.
- For sample surveys, the calculated indicators are estimates of the true population values. If the survey team has used probabilistic sampling, they can measure the uncertainty around the estimate. Again, gross measurement and coverage errors could affect the population that the survey describes. It is important to assess whether the margin of error around the estimated indicators is of narrow enough to draw any conclusions. If investigators have over-sampled certain sub-groups, they must weight estimates to reflect the true proportions of each sub-group in the population.
- Most census offices undertake a post-enumeration survey (PES) to assess the census population count. They conduct a census in a random sample of areas and observe the differences between this count and the census count. They then adjust the reported census count. For example, Statistics South Africa conducted a PES after its 2011 census. The uncorrected census population count was 42.51 million people. But the PES indicated that this figure omitted 6.29 million people, so the final count became 49.79 million people (indicating a net undercount of 14.6%). They also used the PES findings to assess the quality of key characteristics such as age and sex.
Additional criteria for assessing quality
Data quality frameworks
All data quality frameworks focus on the extent to which the dataset reflects what it is intended to measure. These are issues that concern data producers, but users are also concerned about other quality dimensions of the dataset.
For example, the Canadian Institute for Health Information Information Quality Framework assesses and rates the quality of information using dimensions based on the United Nations Statistical Commission’s National Quality Assurance Framework (NQAF).
Dimensions by which the CIHI assesses information quality:
- Relevance: does the information meet users’ current and potential needs?
- Accuracy and reliability: does the information correctly and consistently describe what it was designed to measure?
- Comparability and coherence: is the information consistent over time and across providers, and can it be easily combined with other sources?
- Timeliness and punctuality: is the information current and released on schedule
- Accessibility and clarity: is the information and its supporting documentation easily accessed and clearly presented in a way that can be understood?
An additional essential trust dimension is security, that is protection of data or information from unauthorized access or editing. All institutions handling personal data must ensure that they protect and de-identify, where necessary, all personal data and that they publish and monitor their procedures for maintaining data confidentiality.
Guidelines
Guidelines are available for maintaining key data sources and for assessing data quality and information integrity including for:
- Population censuses: United Nations Department of Economic and Social Affairs. Statistics Division. Handbook on the management of population and housing censuses. Second Revision. New York: United Nations
- Civil registration and vital statistics systems: World Health Organization. Improving the quality and use of birth, death and cause-of-death information: guidance for a standards-based review of country practices; United Nations Department of Economic and Social Affairs. Statistics Division. Principles and recommendations for a vital statistics system.
- Household surveys: Groves et al Survey methodology; World Health Organization Recommended format for a research protocol
- Routine health information systems: World Health Organization. What is Health Information and Intelligence Platform (HIIP); Aqil et al Prism tools user guide; Health Metrics Network. Framework and standards for country health information systems.
- Surveillance of communicable: World Health Organization. World health statistics 2006; Centers for Disease Control and Prevention. Updated Guidelines for Evaluating Public Health Surveillance Systems; World health Organization. And of non-communicable disease: The WHO STEPwise approach to surveillance of noncommunicable diseases (STEPS)
- Research studies: Equator Network. Enhancing the quality and transparency of health research.
Documentation
The major products of data collection are the dataset and any reports based on analysis of the data. Thorough documentation allows others to understand and assess quality and further analyse the data using more sophisticated techniques.
Documenting the dataset
Whether the data are for the sole use of an investigating team or to be made publicly available for others to analyse, datasets must be well-documented with data organized and stored in an accessible format – with clear description, or metadata. Standardised and consistent metadata standards are essential for data sharing. The Organization of Economic Co-operation and Development (OECD) Health Statistics publication, for example, links to a comprehensive metadata dictionary that covers data definitions, sources, and methods for all the indicators. The United Nations maintains a metadata dictionary for Sustainable Development Indicators.
The Canadian Institute for Health Information suggests that data managers document a metadata repository under the following headings:
- Description of the dataset with detailed background information about the context in which the data were collected
- Criteria for selecting the units of observation
- Methods of data collection and capture
- Data processing procedures including description of data editing
- Any data analysis and dissemination already undertaken
- Details of data storage
- All relevant documentation dealing with data quality.
Although post-collection data errors occur in all datasets, data managers rarely describe their data cleaning processes, especially for routine data collection activities (see Leek and Peng). To enhance users’ trust, data managers should specify how they have cleaned data to address problems such as miscoding and follow rules in dealing with missing values; if they have imputed any values, they need to document what they have done. This helps reassure data users of the integrity of the data and absence of manipulation.
Data producers may not publish data reports because they don’t want to reveal poor data quality. We consider this to be a mistake. Data producers are more likely to gain the trust of data users if they are transparent about data limitations. And nothing is more conducive to improving data quality that making information available, throwing the light of day on the dark corners of a dataset. For example, the 2015 Statistics South Africa report of mortality and causes of death, is explicit about data quality limitations.
Documenting information based on the dataset
All reports or papers should provide the context for the data collection.
A conflict of interest statement can enhance users’ trust in data, whether derived from routine data collection or from special studies and surveys. These statements can be particularly sensitive in areas where the interests of public health and of private sector businesses intersect.
Most reports based on these data sources present information quite simply as trends in indicators over time and space and disaggregated by population sub-groups, time and space.
- Census reports publish the actual breakdown of the counted population by age, sex, enumeration area and provide further tables depending on the census questionnaire.
- Civil registration reports provide estimates of birth rates, and death rates by age and cause, broken down by socio-demographic and geographic areas.
- National household surveys publish detailed cross-tabulations and estimates for specific population sub-groups.
Tables and visualizations
Reports should include tables showing non-response and missing values and summarize and assess the likely impact of any errors introduced during data collection and cleaning.
Tables provide the most detailed information, but diagrams can illustrate distributions of indicators between key groups, across time and by geographic area. Most people find simple visual presentations such as charts and maps easier to understand than large tables or long lists of numbers. However, there are many ways that visuals provide misleading information, whether deliberately or, as is more often the case, unintentionally (see Hosseinpoor and AbouZahr).
Sophisticated software makes it easy to produce charts, maps and innovative visualisations but a balance must be struck between design and function; complicated visualizations can fail to communicate. Infographics are increasingly used to convey information that tells a story using easy to understand visuals and minimal text. Major challenges are how to present probabilities and uncertainty, particularly when users have different levels of statistical literacy. Spiegelhalter et al. offer some sound advice on ways of visualising uncertainty that are relevant to charts and figures in general.
Some principles for interpretation
The basic principles for interpreting both tables and diagrams are to ascertain:
- The number of units on which the table/diagram is based
- Whether there are any missing values and how they are distributed among sub-groups
- How percentages were calculated (using the total number of units, or numbers in sub-groups in their denominators)
- What is the range or standard deviation of indicators expressed as averages (for example, average blood pressure)
- For diagrams, check the scales of each axis and whether there is any break in the axis that could misrepresent findings
Reference materials are available to guide the presentation of demographic and epidemiological information.
Challenges
We have described criteria for maintaining and assessing the quality of data and information. But even adherence to the highest quality standards does not necessarily engender the user’s trust.
The OECD has developed survey modules for countries to assess the public’s trust in official statistics.(45) They suggest that trust in official statistics depends both on trust in the statistical products and on trust in the institution producing them. The OECD uses criteria similar to those in Box 22.2 to assess data products. But they suggest that trust in the institution producing them depends on:
- The extent to which they protect or are perceived to protect data confidentiality
- Operate impartially without political interference
- Produce statistics openly and transparently
- Maintain an honest relationship with the public and other key stakeholders. This includes the institution disseminating information about how and why it collect data, holding regular consultations, listening to criticism and correcting erroneous data and publicly addressing misleading media reports.
External factors also influence the public’s trust in data and these include the political environment. Despite all the checks we have described, and the privacy and security commitments that may be in place, the quality of data and information depend on the population’s trust in the institution collecting the data, and in the government that finances and plans to use the results.
Contents
Source chapter
The complete chapter on which we based this page:

Macfarlane S.B., AbouZahr C. (2019) A Matter of Trust: Data Quality and Information Integrity. In: Macfarlane S., AbouZahr C. (eds) The Palgrave Handbook of Global Health Data Methods for Policy and Practice. Palgrave Macmillan, London. Read More.
Additional resources
Canadian Institute for Health Information. CIHI’s Information Quality Framework.
Canadian Institute for Health Information. Privacy and security risk management framework 2015
Organisation for Economic Co-operation and Development. Measuring Trust in Official Statistics: Cognitive Testing.
United Nations Statistical Commission. Guidelines for the Template for a Generic National Quality Assurance Framework (NQAF).
Biemer P. Total Error: Adapting the paradigm for big data.
Groves RM, et al. Survey methodology.
Zhang Chun. Topics of statistical theory for register-based statistics and data integration.
Van den Broeck J et al. Data cleaning: Detecting, diagnosing, and editing data abnormalities.
Leek JT, Peng RD. Statistics: P values are just the tip of the iceberg.
Duquia RP et al. Presenting data in tables and charts.
United Nations Economic Commission for Europe. Making Data Meaningful. Part 2. A guide to presenting statistics.
Spiegelhalter D, Pearson M, Short I. Visualizing Uncertainty About the Future.